Geoscience Reference
In-Depth Information
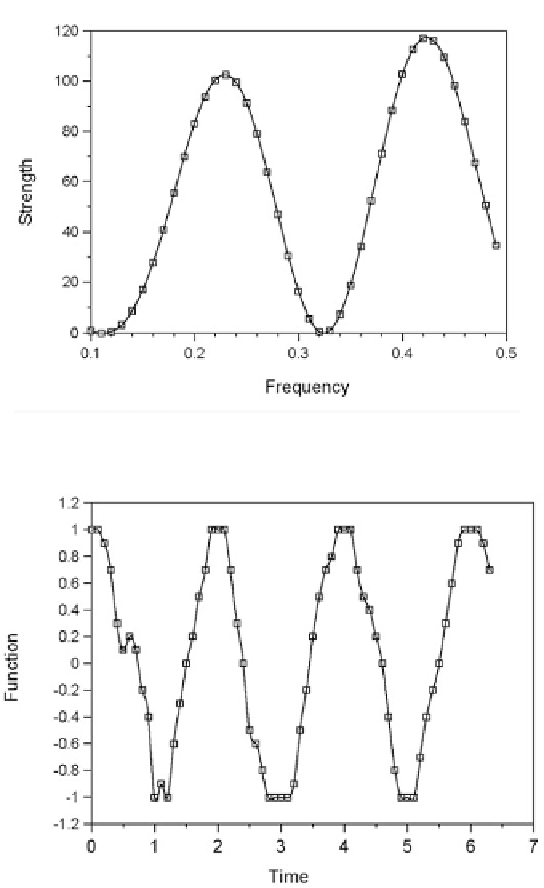
Figure 10.21. Spectral distribution of frequencies corresponding to function F
ð
t
Þ¼
cos
ð
1
:
5t
Þþ
cos
ð
2
:
5t
Þ
. Principal frequencies are at 0.23 and 0.42 units.
Figure 10.22. A hypothetical function with quasi-periodic behavior.
10.3.2 Spectral analysis of solar and paleoclimate data
M&M described a number of alternative approaches for estimating the
spectral distributions corresponding to solar and paleoclimate data. These are
beyond the scope of this topic and we refer the reader to M&M for information
on these methods. We will content ourselves here with merely commenting on
their results.
Search WWH ::

Custom Search