Geoscience Reference
In-Depth Information
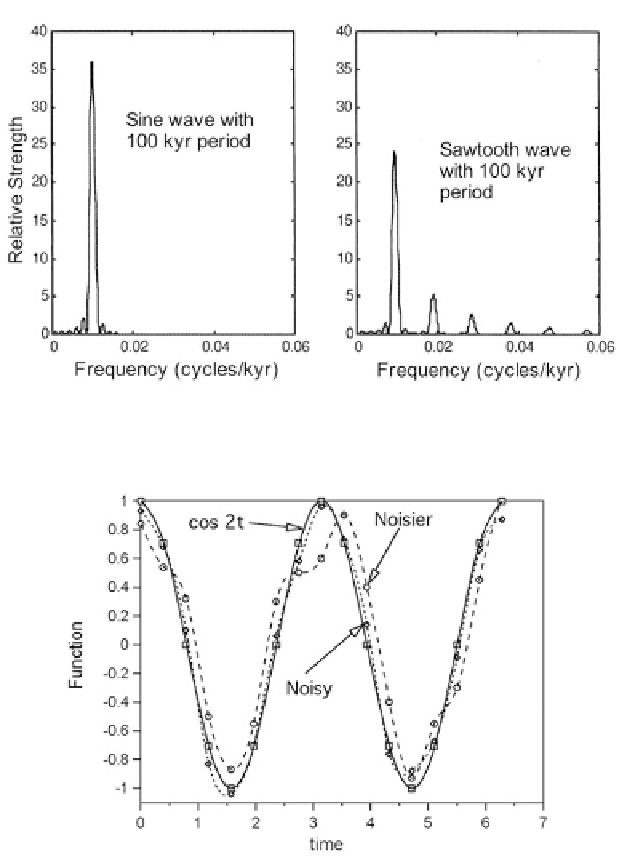
Figure 10.17. Spectra of sine wave and sawtooth wave with 100,000-year periods.
Figure 10.18. Three simple functions for spectral analysis. The solid curve is cos
ð
2t
Þ
and the
dashed curves add noise to this curve. The period of the solid curve is
.
Another simple example is given in
Figure 10.20
,
which displays 17 points
from the curve:
F
ð
t
Þ¼
cos
ð
2
:
5t
Þþ
cos
ð
1
:
5t
Þ
When the same spectral procedure is carried out on these 17 points, the resultant
frequency distribution is as shown in
Figure 10.20
. There are now two primary
frequencies at 0.23 and 0.42 cycles per unit time, corresponding to periods of
4.5
2
/1.5 and 2.4
2
/2.5 time units (see
Figure 10.21
).
Search WWH ::

Custom Search