Geoscience Reference
In-Depth Information
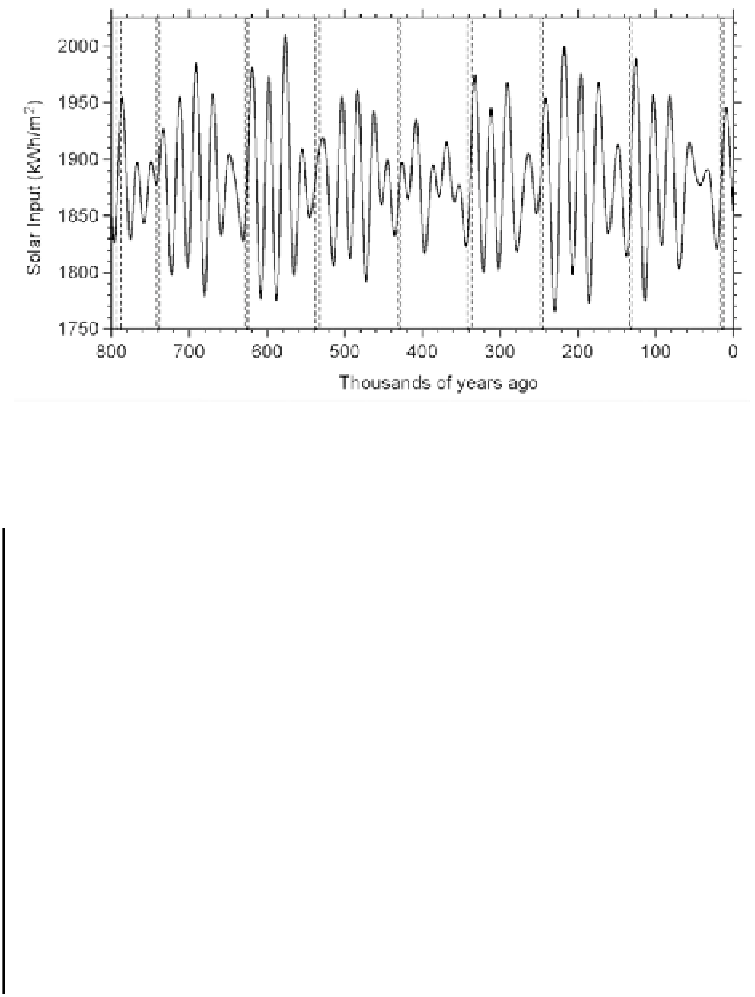
Figure 10.9. Peak solar intensity at 65
N shown along with termination ramps (from
Rothlisberger et al., 2008).
Table 10.4. Comparison of estimated dates for onset of terminations (
kybp
).
Termination Rothlisberger Raymo (1997)
Lisiecki
Huybers
Schulz
et al. (2008)
and Raymo
and Wunsch
and Zeebe
(2005)
(2004)
(2006)
1
17.6
14
11
23
2
135.4
130
129
139
3
246
248
243
239
253
4
341
339
337
332
345
5
431
424
424
419
419
6
540
535
533
532
546
7
629.5
622
621
623
632
8
741
9
796
Kawamura et al. (2007) presented high-resolution chronologies of the last four
glacial terminations. Their results are compared with those of Rothlisberger et al.
(2008) in
Figures 10.10 to 10.13
. There is very good agreement between these two
investigations. The variation in peak solar intensity at 65
N and 65
S is also


Search WWH ::

Custom Search