Geoscience Reference
In-Depth Information
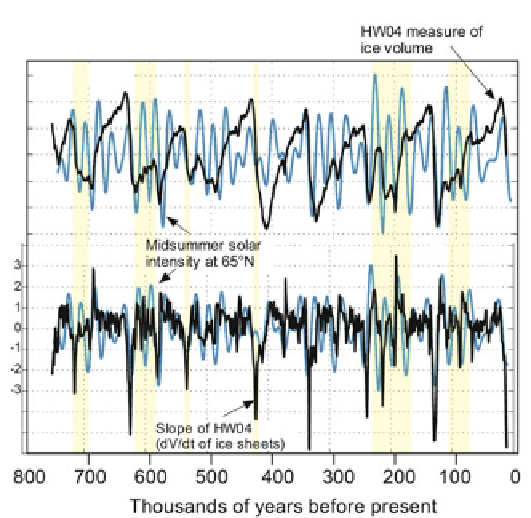
over the past 800,000 years. Note that the solar curve is plotted inversely so that higher solar
intensities lie lower on the vertical scale (adapted from Roe, 2006). The vertical yellow bands
are time periods discussed in the text. Note the horizontal offset of the dV
=
dt curve from the V
curve. This was necessary to make the near-vertical features of the dV
=
dt curve match the near-
vertical features of the V curve.
tooth features in the V curve reliable? At around 540
kybp
, there was a modest
increase in solar intensity accompanied by a large decrease in the ice volume. Why
did this relatively small change in solar intensity produce a large change in the ice
volume? Around 430
kybp
an even smaller increase in solar intensity produced a
much larger reduction in the ice volume. Between about 230 and 180
kybp
, there
were three large oscillations in solar intensity. The first and third produced
increases in ice volume while the second produced a decrease. Between about 100
and 70
kybp
, the situation was similar to that between 620 and 590
kybp
when
large changes in solar intensity are associated with small sawtooth features on the
ice sheet volume curve. If the small sawtooth features on the ice volume curves are
credible, the comparison of dV
dt with solar intensity is better, but it is far from
perfect. There is a degree of chartsmanship in
Figures 10.6
and
10.7
and, when the
graphs are expanded to much larger sizes, the discrepancies are more discernible.
Nevertheless, the results, even for HW04, are highly suggestive of solar influence.
Roe's final conclusion sums up the situation well:
=
''The Milankovitch hypothesis as formulated here does not explain the large
rapid deglaciations that occurred at the end of some of the ice age cycles: many
Search WWH ::

Custom Search