Geoscience Reference
In-Depth Information
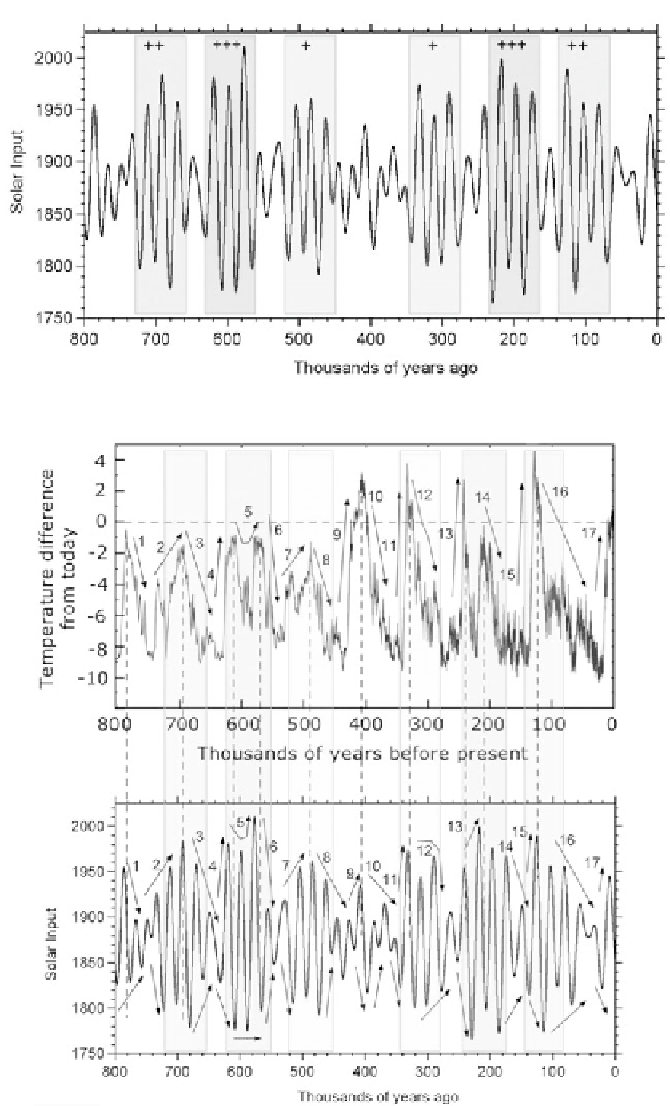
Figure 10.2. The variation of solar input to 65
N over the past 800,000 years.
Figure 10.3. Comparison of Antarctic ice core data with calculated solar input at 65
N over
800,000 years: (upper panel) Antarctic data; (lower panel) solar input to 65
N.
Search WWH ::

Custom Search