Geoscience Reference
In-Depth Information
the 20th century (e.g., CO
2
¼
355 ppm) whereas concentrations during ice ages
ranged from 190 to 280 ppm. Furthermore, their results were presented in a
manner that makes it dicult to decipher. Nevertheless, they did find that lower
obliquities led to greater snowfall at higher latitudes in the NH, which could
possibly lead to the greater dependence of ice ages on obliquity than other orbital
parameters. This begs the question why this occurred prior to about 1
mybp
and
not after. Jackson and Brocolli (2003) also used a climate model to investigate the
past 165,000 years. They reported ''prominent decreases in ice melt and increases
in snowfall are simulated during three time intervals near 26, 73, and 117
thousand years ago when aphelion was in late spring and obliquity was low.''
However, these variations were less than
10%.
9.5 HISTORICAL SOLAR IRRADIANCE AT HIGHER LATITUDES
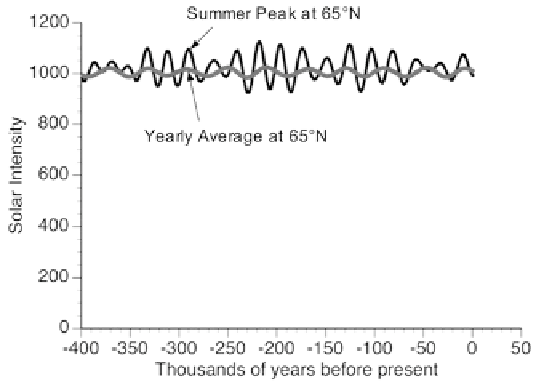
In almost all descriptions of solar irradiance variability at high latitudes, an offset
zero is used to emphasize the variability. However, when plotted in the normal
way with zero as the base of the vertical scale, peak solar intensity in summer and
This figure shows that the actual magnitude of these variations is small compared
with the average level. Yet, according to the astronomical theory, it is these small
variations in solar intensity that drive glacial-interglacial cycles.
Yearly solar irradiance at several high northern latitudes calculated for the
400,000 years and 800,000 years are shown in
Figures 9.10
and
9.11
with
expanded vertical scales. It can be seen that the patterns for several latitudes are
Figure 9.8. Calculated peak solar intensity in summer and yearly average solar intensity at
65
N.

Search WWH ::

Custom Search