Geoscience Reference
In-Depth Information
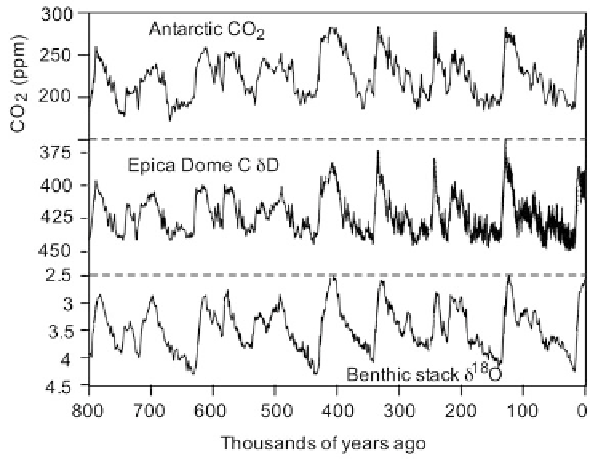
Figure 4.19. CO
2
, Epica Dome C
d
D, and benthic stack
d
18
O for the past 800,000 years
(Tzekadis et al., 2009).
They found that these divided into two groups. One group which they labeled
''warm interglacials'' had CO
2
concentrations above 260 ppm, and the majority of
these also had benthic stack
d
18
O values below 2.8
. Another set had CO
2
con-
centrations below 260 ppm and all of them had benthic stack
d
18
O values above
2.8
%
. These were labeled ''cool interglacials''. Except for the extended interglacial
period from about 240 to 190
kybp
, all of the interglacials more recent than
420
kybp
were warm interglacials. All of the previous interglacials, as well as the
period from about 240
kybp
to 190
kybp
, were cool interglacials.
Miller et al. (2010) said:
%
Arctic
summers were
5
C warmer than at present, and almost all glaciers melted
completely except for the Greenland Ice Sheet, and even it was reduced in size
substantially from its present extent. With the loss of land ice, sea level was about
5m higher than present, with the extra melt coming from both Greenland and
Antarctica as well as small glaciers.''
''During the penultimate interglaciation,
130 to
120 ka ago,
...
Yet the measured CO
2
concentration during this period was still
less than
300 ppm!
Uriarte (2009) discussed the penultimate interglaciation at some length. He
indicated ''that at the height of that interglacial epoch, global temperatures were
between 1
C and 2
C warmer than today.'' However in some localities, models
Search WWH ::

Custom Search