Geoscience Reference
In-Depth Information
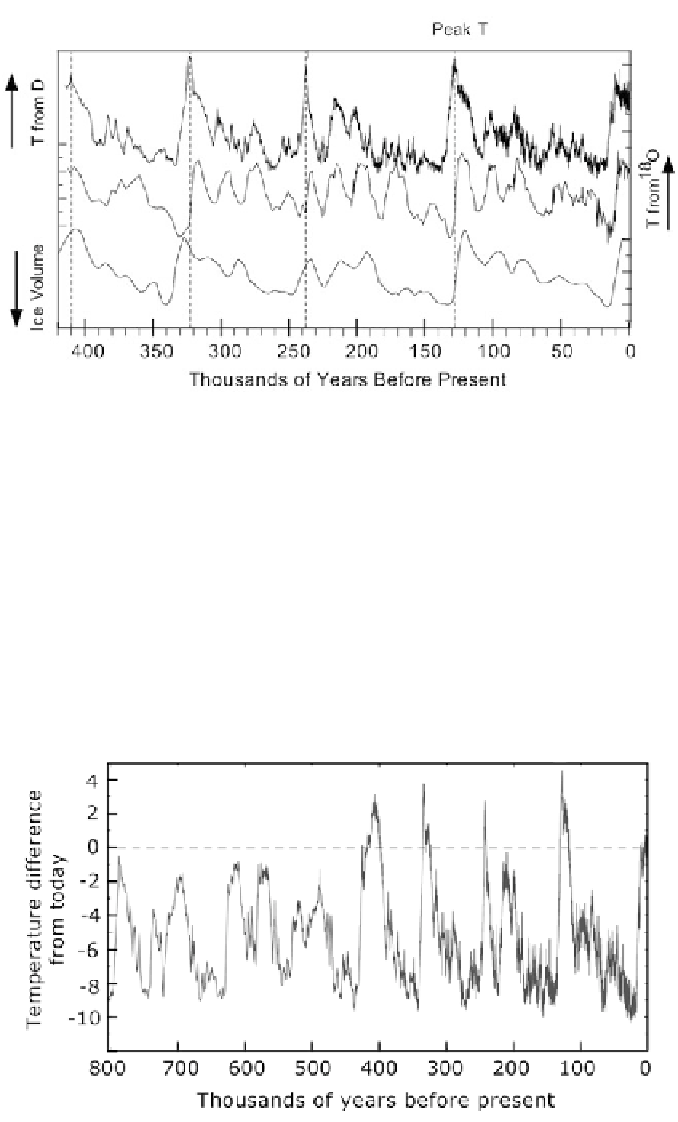
Figure 4.9. Vostok ice core data. The upper curve is variation of temperature as interpreted
from
d
D vs. depth of the ice core. The middle curve is the
d
18
O profile in the atmosphere from
gas bubbles. The lower curve of ice volume implied by
d
18
O in ocean sediments is provided for
comparison (Petit et al., 1999).
Figure 4.10. Estimated temperature difference from today at EPICA Dome C vs. age (EPICA,
2004).
Search WWH ::

Custom Search