Geoscience Reference
In-Depth Information
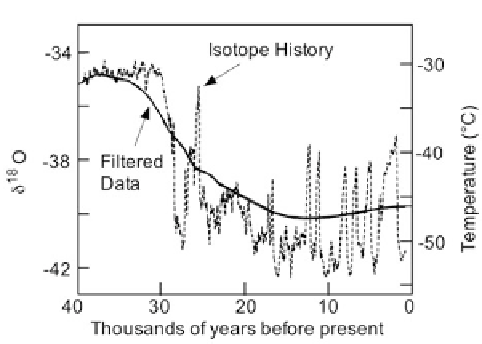
Figure 3.18. Filtered isotope data (Cuffey et al. 1995).
using this T vs. depth as the forcing function on the upper surface of the ice sheet
in a linked heat flow-ice flow model. They then compared the modeled T vs.
depth with the GISP2 data and adjusted A and B to minimize the mismatch
between modeled and measured subsurface temperatures. They found that using
the conventional values of A and B based on current
d
18
O vs. T correlations, they
could not get good agreement between the curves of T vs. depth from the heat
flow-ice flow model and T vs. depth from the isotope data. Instead, they had to
reduce A significantly, leading to the conclusion that past temperature variations
corresponding to measured changes in
d
18
O were considerably greater than had
been supposed based on current data for
d
18
O vs. T. They found that this result
was robust to changes they imposed on the model and concluded that previous
estimates of the temperature difference between the Ice Age and the Holocene
were underestimates.
In a later paper, the authors refined their study, presented further details on
their model, and extended the time scale to 50,000
ybp
(Cuffey and Clow, 1997).
They rearmed that the change in temperature from average glacial conditions to
the Holocene was about 15
—about double the value inferred from isotopic
thermometry using current data for the relationship between
d
18
O and T. One
interesting aspect of their paper is that they found that the thickness of the Green-
land ice sheet probably increased slightly during the deglaciation that occurred
starting about 15,000
ybp
. This was due to an increase in the snow accumulation
rate due to the availability of moisture in the nearby atmosphere as deglaciation
proceeded (see
Figure 3.19
).
Another borehole study found similar results for the difference between Ice
Age and Holocene temperatures (Dahl-Jensen, 1998). One interesting result of this
study was strong evidence of global warming centered around 900
ad
(Medieval
Warm Period) and cooling from 1500 to 1900, but with an upward bump around
the midpoint of that interval (Little Ice Age).
Search WWH ::

Custom Search