Geoscience Reference
In-Depth Information
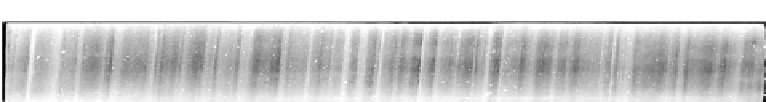
Figure 3.5. Section of the GISP2 ice core from 1,837-1,838m deep in which annual layers are
clearly visible. The appearance of layers results from differences in the size of snow crystals
deposited in winter vs. summer and resulting variations in the abundance and size of air
bubbles trapped in the ice. The age range of this section was about 16,250
20 years
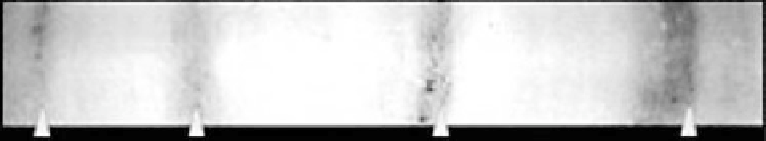
Figure 3.6. Section of an ice core drilled in the Kunlun Mountains of Western China. The thick
lighter bands indicate heavy snowfall during the monsoon season around the year 1167
ad
,
while the thinner darker strips show layers of dust blown into the snowfield during the
dry season (photo attributed to Lonnie Thompson:
http://www.pbs.org/wgbh/nova/warnings/
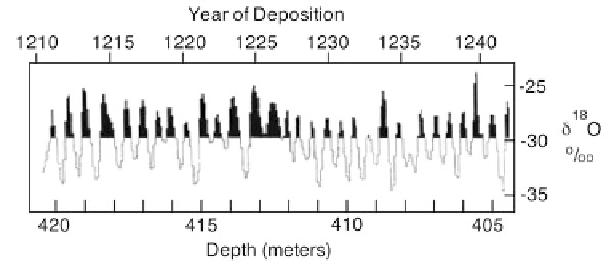
Figure 3.7a. Layering as evidenced by periodic variations in
d
18
O (Dansgaard, 2005).
always straightforward and the resolution of individual years can be a very
subjective process.
Other examples of visually observed ice core layers are shown in
Figures 3.5
and
3.6
.
The effect of volcanic eruptions on the annual variation of
d
18
O is significant
increment that shows very clear effects of large volcanic eruptions. In addition to
d
18
O, measurements of
d
D and electrical conductivity have also been used to
discern yearly layers.
Search WWH ::

Custom Search