Geoscience Reference
In-Depth Information
(a)
(b)
(c)
(d)
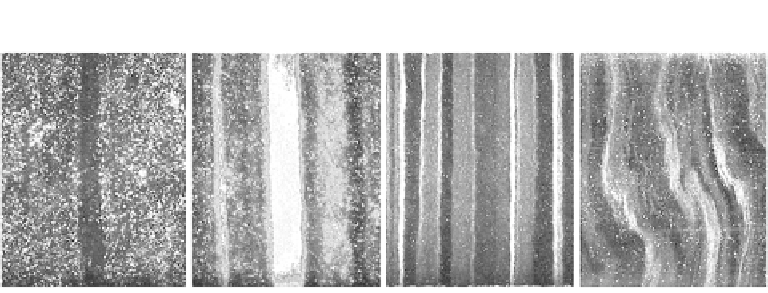
Figure 3.4. Close-up examples of line scan images (rotate 90
to compare with previous figure).
The sections shown are 6 cm high and 7.5 cm wide. (a) 1412.1m depth, Holocene ice with visible
air bubbles. The band of clear (dark) ice indicates a possible melt layer or ice where the air
bubbles are converted into clathrate hydrates. (b) 1,506.1m depth, the visible Vedde volcanic
ash layer in the Younger Dryas. (c) 1,836.9 m depth, detailed layering around the Last Glacial
Maximum. (d) Example of microfolding at 2,675.0m depth. At greater depths the layering is
again more regular (Svensson et al., 2005).
intensity and the frequency of visible layers or cloudy bands were highest (
Figures
3.3b-d
).
A very distinct transition between ice drilled during the 1999 season and ice
recovered in the 2000 season is found at the 1,751.5m depth (
Figure 3.3c
). It is
also noteworthy that ice that was stored for one year at NorthGRIP showed
much more pronounced cloudy bands than freshly drilled ice. Also the density of
white patches and bubbles are much higher in the stored ice. This clearly demon-
strates that the internal structure of the ice core relaxes after recovery, even when
the ice is stored under optimal cold conditions.
Down to a depth of about 2,600m, horizontal layering of the ice is very
regular (
Figure 3.3f
). Below this depth small disturbances in the layering such as
microfolds start to appear (
Figures 3.3g
and
3.4d
). Below 2,800m, the visual
stratigraphy becomes more uncertain with more diffuse and inclined layering, and
in some depth intervals it is impossible to distinguish individual layers (
Figure
3.3h
). The ice crystals in the deepest ice are large, of the order of 1-10 cm
diameter, and in the lowest 100m of the ice core ice crystal boundaries are visible
in the line scan images (
Figure 3.3i
).
Unfortunately, layer counting is not feasible in central Antarctica where
annual cycles are barely distinguishable due to low annual accumulation (Parrenin
et al., 2007a). However, layers can be discerned in the upper part of the core at
Law Dome (on the coast), which receives a great deal more snow than the inland
domes.
Over the most recent 110,000
ybp
, annual dust or cloudy bands were the most
prominent annual layer markers of the GISP2 core:
''During the late spring and summer in Greenland, there is an influx of dust.
This dust peak is in part a result of dust storms that occur in both hemispheres
Search WWH ::

Custom Search