Geoscience Reference
In-Depth Information
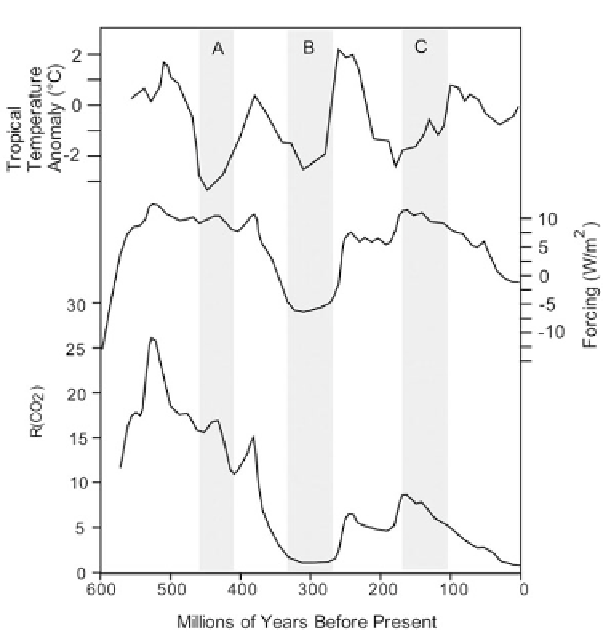
Figure 2.33. Comparison of R(CO
2
) with temperature changes during the Phanerozoic. The
upper curve is tropical sea temperature anomaly. The middle curve is estimated forcing due to
changing CO
2
, taking into account the gradually strengthening Sun. The lower curve is
estimated R(CO
2
). Gray areas A and C are time periods when CO
2
is disjoint with temperature,
while gray area B has CO
2
and temperature in good agreement (adapted from Crowley and
Berner, 2001).
indices. In light of these results, it is important to reevaluate the validity of the
assumed CO
2
-climate link. Here we address this issue by comparing estimates of
Phanerozoic CO
2
variations and net radiative forcing with the continental glacia-
tion record and low-latitude temperature estimates.''
Crowley and Berner (2001) then went on to compare the best available data
on Phanerozoic temperatures from oxygen isotopic composition of fossils with
forcing represents a combination of two things. One is the effect of variable CO
2
due to the greenhouse effect. The other is the fact that solar intensity increased by
about 6% during the Phanerozoic. Early in the Phanerozoic, with solar intensity
6% lower than at present, the solar forcing would have been about
14W/m
2
.
Search WWH ::

Custom Search