Geoscience Reference
In-Depth Information
modelled so it cannot be properly removed but, neverthe-
less, the requirement for removal remains. There exists an
extensive literature on regional removal, often referred to
as
a)
Gravity
(gu)
50
, and various techniques
are used. Hearst and Morris (
2001
) show how subjective
regional removal can give rise to con
icting interpretations
of gravity data from the well-known Sudbury structure in
Ontario, Canada.
The two most common approaches to removing the
regional response involve either using a smooth mathemat-
ical function to approximate the regional or filtering the
data to remove the longer-wavelength variations (see
Frequency/wavelength in
Section 2.7.4.4
)
. Neither approach
is universally applicable, notwithstanding the fact that
determining whether a particular approach is
'
regional
-
residual separation
'
40
Observed
30
20
Regional
10
0
20
Residual
10
0
0
200
Gossan
Metres
is
a purely subjective decision. It is often the case that the
process needs to be repeated with different interpolation/
'
correct
'
Mineralisation
Quartoze sedimentary rocks
Graphitic, chloritic sedimentary rocks
residual response is
obtained. Ultimately, the task for the interpreter then is to
find a residual response, from an in
nite number of possi-
bilities, which is the most geologically plausible. The target
anomaly will inevitably be distorted in some way.
We describe here some aspects of regional removal,
emphasising the practicalities of the process. At this stage
it is worth saying that avoiding the problem altogether
may, in some situations, be the best approach. Sometimes
it may be better to account for all scales of variation in the
observed data, even if this necessitates making gross
assumptions about the deep geology of the area, rather
than remove some arbitrary regional component. At least,
in this case, the assumptions about the local geology are
known to the interpreter. On the other hand, not to
remove some form of the regional variation can severely
limit the interpretation of important local responses.
filter parameters until an
'
acceptable
'
b)
TMI
(nT)
40
Observed
30
20
Regional
10
0
-10
20
Residual
10
0
Surface
0
200
Marcasite
mineralisation
Metres
c)
SP (mV)
SP (mV)
0
200
400
600
800
0
200
400
600
Ore
intersection
2.9.2.1
Interpolation methods
Surface and curve
fitting techniques involve interpolating
the broader regional response into areas dominated by the
Residual
Figure 2.37
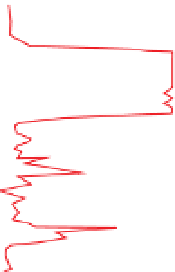
Examples of regional removal. (a) Gravity data and
geology from the Murray Brook massive Cu
-
Pb
-
Zn sulphide
deposit, New Brunswick, Canada. Redrawn, with permission, from
Thomas (
1999
). (b) Magnetic data across a Mississippi Valley-type
Pb
-
Zn deposit, Pine Point area, Northwest Territories, Canada.
Downhole self-potential data from a drillhole intersecting the Joma
pyrite deposit, Trøndelag, Norway. Redrawn, with permission, from
Skianis and Papadopoulos (
1993
).
Observed
25
Regional
0
Metres


Search WWH ::

Custom Search