Geoscience Reference
In-Depth Information
a)
b)
c)
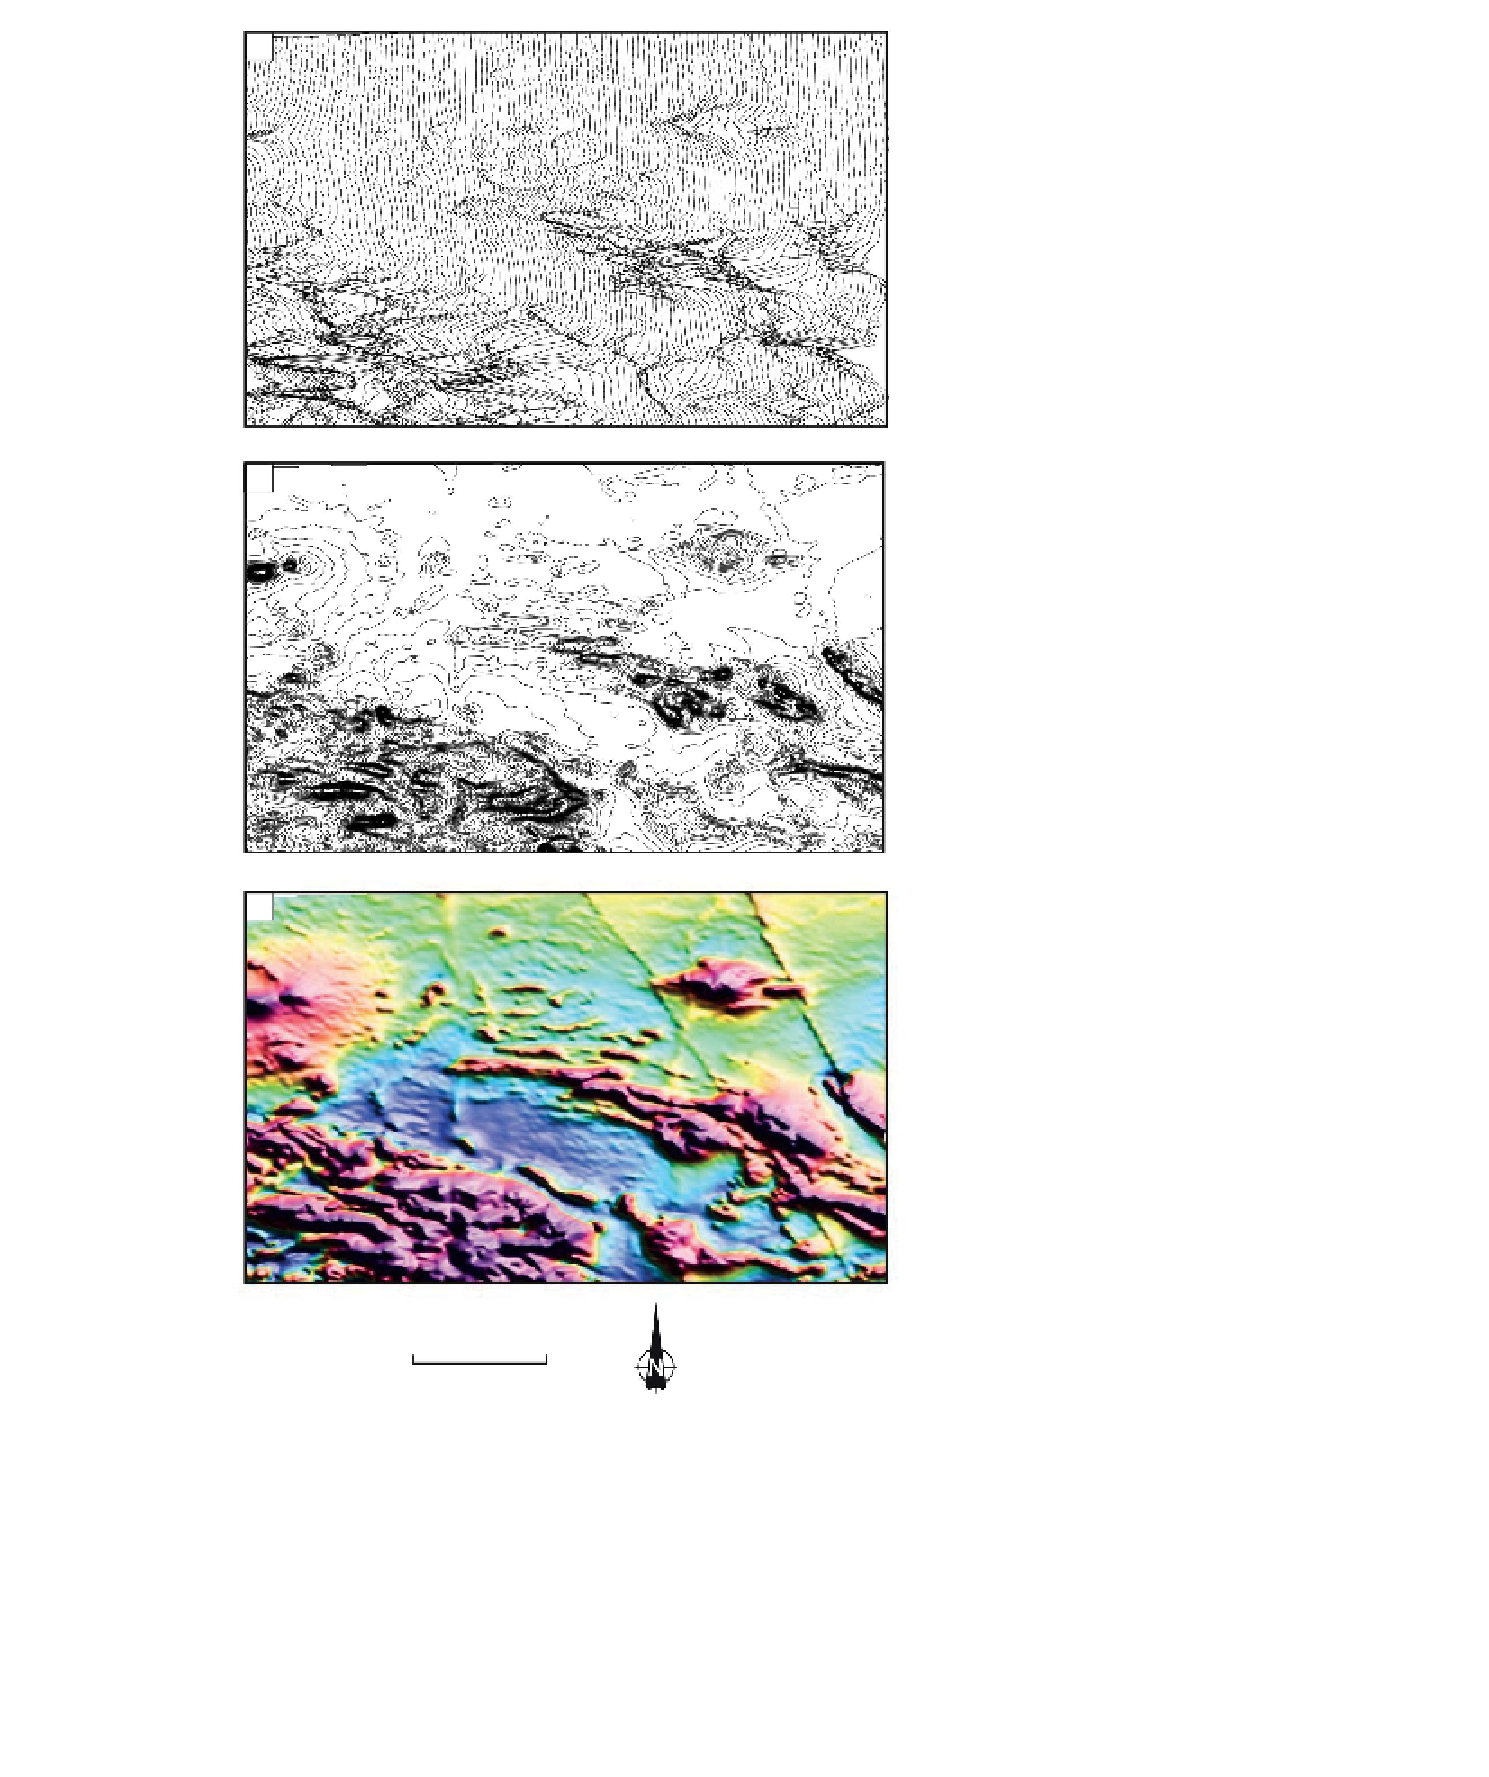
Figure 2.30
Examples of various forms of display
for 2D datasets. (a) Stacked pro
les, (b) contours,
(c) image. Data are aeromagnetic data from the
Kirkland Lake area, Ontario, Canada. Source:
Ontario Geological Survey © Queen
0
5
'
s Printer for
Kilometres
Ontario 2014.
of 2D display having the important characteristic of accur-
ately and conveniently depicting the actual amplitude at a
point on the geophysical map. They are an effective form
of display when the attitude of sources needs to be esti-
mated (see
Section 2.10.2.3
).
The display of 2D and 3D data as pixelated images
(
Fig. 2.30c
) is ubiquitous in modern geophysics. The tech-
nique is based on either varying the intensity or brightness
of white light, or applying a range of colours, or applying
both simultaneously, over the amplitude range of the data.
Search WWH ::

Custom Search