Geoscience Reference
In-Depth Information
or
a complicated response reducing it to a
more interpretable form.
The
filtering operation to be reversed by deconvolution
is normally associated with some undesired aspect of a
signal
'
unravelling
'
a)
10
Kilometres
0
often modi
cation by its passage through the
subsurface, or its imperfect representation by the geophys-
ical detector and recording system. Removing unwanted
aspects of a
lter
-
'
s response requires knowledge of the
lter
is characteristics. This is a realistic expectation when
the problem is associated with the data acquisition equip-
ment. However, when the problem is due to the Earth filter
it is usually not possible to describe the filter characteristics
completely, since again the geophysical paradox applies:
the optimal understanding of the geophysical response
requires the very knowledge the geophysical response is
intended to provide. Deconvolution is very commonly
used in the processing of seismic data and is described
further in
Section 6.5.2.2
).
'
b)
2.7.4.5
Example of enhancing geophysical data
In order to illustrate the enhancement of geophysical data
using the techniques described above, an example of
removing noise from airborne EM data (see
Section
signal is a (1D) time series comprising a decaying voltage
which is repeating 10 times, with alternate polarity, over a
period of 200 ms. The data are sampled every 0.025 ms,
resulting in each decay cycle being defined by 768 data
decays are shown in the figure.
The unprocessed (raw) data are contaminated by an
approximately sinusoidal variation caused by turbulence
of the survey aircraft affecting the position and orientation
of
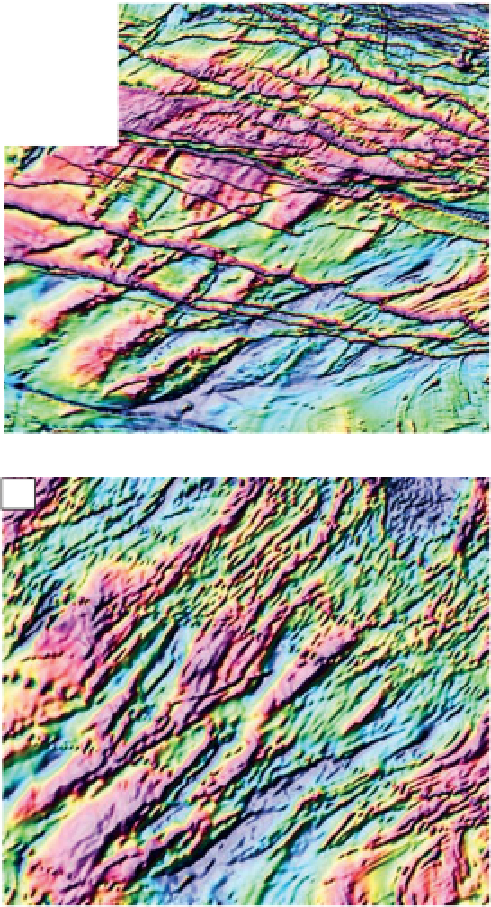
Figure 2.27
Directional filtering of aeromagnetic data to remove
linear anomalies associated with dykes. (a) Raw data, (b)
filtered
data. Original
figure based on data supplied courtesy of the
Geological Survey of Botswana.
applied and, mathematically, the filtering process is identi-
cal to a
'
normal
'
directional filter. Known as F
-
k filtering,
'
caused by electrical activity in the atmosphere. The aim is
to remove these two kinds of noise from the data. The
relatively long-wavelength sinusoidal noise was removed
first, with a high-pass
filter (25 Hz cut-off), and then the
spikes were removed. This required a combination of
median
filters and stacking of adjacent readings as follows.
Firstly, the negative decays were inverted to obtain consist-
ency in polarity. Secondly, the median values of equivalent
samples in the ten decays were obtained. The six samples
furthest from the median were discarded and the mean
obtained from the remaining four. The mean values were
used to construct the
the detector system, and short-wavelength
'
spikes
and also known as dip, fan, pie-slice and velocity
ltering,it
too is based on the 2D Fourier transform. F
filtering is a
powerful tool for removing noise from seismic data.
-
k
Deconvolution
The action of a previous
filtering operation can be reversed
through a process known as deconvolution, also known as
from the fact that a
filter is de
ned in the time or spatial
domain in terms of a convolution (see Convolution above).
Confusingly, deconvolution is also a
filtering operation,
and so can be enacted as a convolution. Less formally,
the term deconvolution may be used to mean simplifying
'
noise-free
'


Search WWH ::

Custom Search