Geoscience Reference
In-Depth Information
probability of detection is based on the requirement
to make a speci
ed number of measurements within
the bounds of the anomalous region (
Fig. 2.13a
).
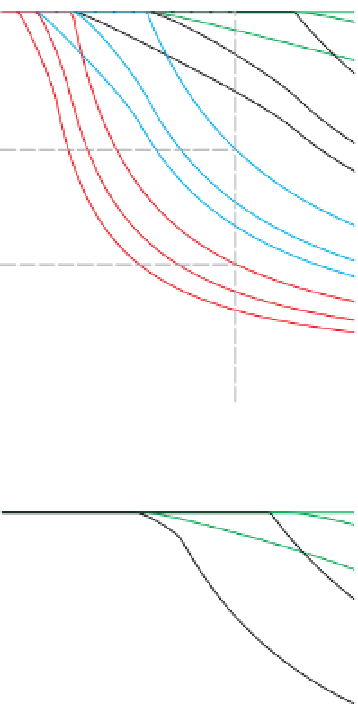
Figure 2.13b
shows the likelihood of detecting elliptical
anomalies with major axes (L) of length 1000, 500, 250
and 125 m, and major to minor axis (W) ratios ranging
from 1 to 4. The data in
Fig. 2.13b
represent aeromagnetic
data acquired with a
fixed-wing aircraft and a data interval
of 5 m. It is assumed that at least five readings are required
to produce a recognisable response, corresponding to a
survey line overlap interval (S) of 20 m with the anomalous
region. For example, a line spacing of 400 m is shown to
have about a 31% chance of resulting in a recognisable
response from a circular (L/W
a)
Station
spacing
L
W
Target
Overlap between
survey line
& detectable
target response
S
Line
spacing
b)
S
=20 m
1.0) target 125 m in diam-
eter (L), and a 62% chance for a target with twice these
dimensions; and as expected, detecting circular features of
500 and 1000 m diameter is a certainty.
Figure 2.13c
assumes that a 200 m overlap is required for detection,
consistent with three readings in a gravity survey with
stations spaced 100 m apart. For this case, the circular
feature of 125 m diameter is undetectable since the
required overlap is larger than the longest dimension of
the target, whereas the 250 m feature has a 38% chance of
being detected. Again, the largest features will de
nitely be
detected. This type of analysis is applicable to all geophys-
ical methods, provided the characteristics of the target
anomaly can be accurately predicted.
¼
1.0
L
/
W
=1.0
L
/
W
=2.0
L
/
W
=4.0
L
/
W
=1.0
0.8
0.62
L
/
W
=2.0
L
/
W
=4.0
0.6
L
/
W
=1.0
0.4
0.31
L
/
W
=2.0
L
/
W
=4.0
L
/
W
=1.0
L
/
W
=2.0
L
/
W
=4.0
0.2
0.0
0
200
400
600
Line spacing (m)
c)
S
=200 m
2.7
Data processing
L
/
W
=1.0
L
/
W
=2.0
1.0
We describe data processing as a two-stage process: data
have aspects in common. Integral to these is the
interpolation of the survey data transforming them into a
regularly spaced distribution of sample points, suitable for
enhancement using numerical methods, for merging with
data from other surveys and for displaying the data.
L
/
W
=4.0
0.8
L
/
W
=1.0
0.6
L
/
W
=2.0
0.4
0.38
L
/
W
=1.0
0.2
L
/
W
=4.0
2.7.1
Reduction of data
L
/
W
=2.0
L
/
W
=4.0
0.0
For most geophysical methods it is necessary to apply a
variety of corrections to the data obtained
0
200
400
600
'
'
raw
from the
Line spacing (m)
field acquisition system in order to
'
reduce
'
, or prepare, the
L
=1000
L
=250
L
=500
L
=125
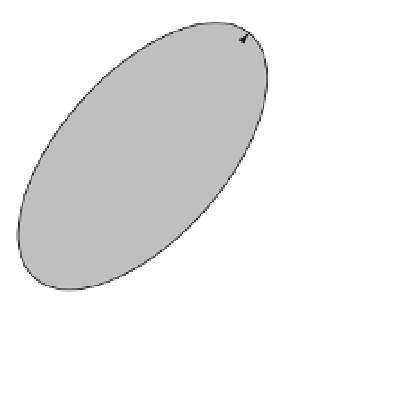
axis length W, with an overlap of at least the speci
ed length S.b)
Probability versus line spacing for an overlap of 20 m. c) Probability
of detection for an overlap of 200 m. Redrawn, with permission,
from Galybin et al.(
2007
).
Figure 2.13
Probability of detecting an elliptical anomaly. (a)
Parameters used to determine the probability of a line-based survey
crossing an elliptical anomaly, with major axis length L and minor


Search WWH ::

Custom Search