Geoscience Reference
In-Depth Information
part of each
figure, raypaths have been superimposed to
show the paths taken by selected parts of the wavefront.
The actual wavefronts are three-dimensional, but a single
vertical cross-section through the subsurface containing
the source is suf
cient to show what is occurring.
The diffracted wavefront expands in all directions, and
part of it encounters the ground surface and may be
recorded by the seismic detectors: that is, the requirement
for the incident wave to be turned around has been met.
A diffracted wave is of low amplitude, compared with the
incident wave, since it derives its energy from only a small
fraction of the latter. The maximum amplitude occurs in
the area immediately above the diffractor since this is the
shortest travel path and so less attenuation has occurred. In
amplitude scaling was applied to attenuate the stronger
incident wavefront.
6.3.4.1
Local discontinuities
Diffraction is the scattering of seismic waves when a wave-
front encounters a diffractor, which is a localised discon-
tinuity in the subsurface
s acoustic impedance whose
boundary curvature is large and/or whose dimensions are
smaller than a Fresnel zone (see
Section 6.3.2
)
. This might
be a localised change (a point diffractor) or the sharp edge
of a larger discontinuity (typically the faulted edge of a
surface).
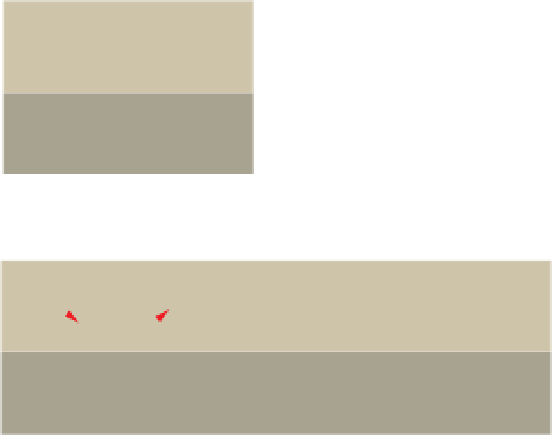
Figure 6.8
shows wavefronts and rays within an Earth
model comprising a point diffractor within an otherwise
homogeneous subsurface. As expected from
Fig. 6.4
, the
wavefront created by the source, the incident wavefront, is
hemispherical (semicircular in the plane of the cross-
section). It expands uniformly from the source, both lat-
erally and downwards, until it encounters the diffractor.
Here it is scattered, the scattered waves forming a second
wavefront which is spherical (circular in the plane of the
cross-section) and centred on the diffractor. The raypaths
of the incident wavefront are radial and centred on the
source. The diffracted rays form a similar pattern centred
on the diffractor.
'
6.3.4.2
Continuous discontinuities
The effects are more complicated when elastic properties
and density change across a laterally continuous interface.
The key phenomenon is the partitioning (splitting) of the
incident wave into two separate waves: the re
ected and
transmitted waves. The directions and the relative amounts
of energy in the two new waves depend on the nature of
the change in acoustic impedance and velocity at the
interface, and vary across the incident wavefront owing
to variation in the direction from which it intersects the
interface. The different effects are described in turn using
rays; but we emphasise that they are inter-related compon-
ents of the same overall process.
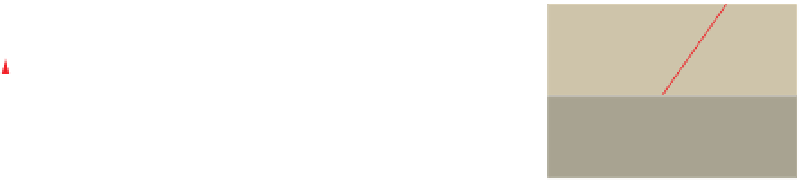
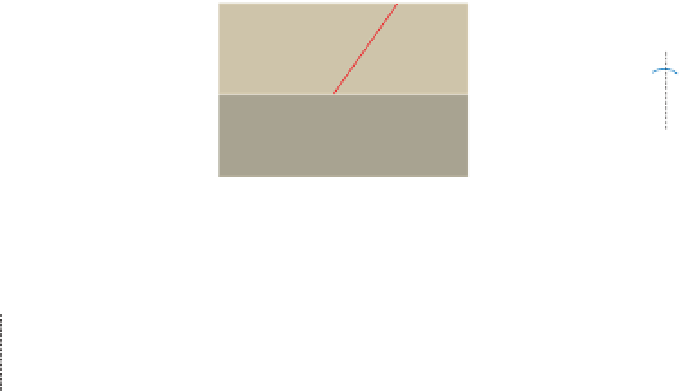
Figure 6.9
shows the changes in directions of the raypath
at the interface, which depends the change in velocity
a)
b)
c)
Incident
Incident
Reflected
Incident
Reflected
qq
qq
Inc
Rfl
Inc
Rfl
Reflected
z
1
V
1
z
2
V
2
z
1
V
1
z
2
V
2
z
1
V
1
z
2
V
2
q
q
Trn
Trn
Transmitted
Transmitted
Transmitted
qqq
=
Rfl
=
= 0°
V
2
<
V
1
V
2
>
V
1
qq
<
z
1
=
z
2
z
1
=
z
2
z
1
=
z
2
Inc
Crit
Inc
Trn
d)
e)
Incident Reflected
Incident
Reflected
q
q
q
q
Inc
Rfl
Inc
Rfl
z
1
V
1
z
2
V
2
z
1
V
1
z
2
V
2
Transmitted (headwave)
q
Trn
V
2
>
V
1
q
=
q
z
1
=
z
2
z
1
=
z
2
q
>
q
Inc
Crit
Inc
Crit
Figure 6.9
Ray diagrams showing the effects of an interface across which there is a change in acoustic impedance. (a) Normal incidence, (b)
oblique incidence with velocity decreasing across the interface, (c) oblique incidence with velocity increasing across the interface, (d) critical
refraction and (e) total internal re
ection.


Search WWH ::

Custom Search