Geoscience Reference
In-Depth Information
Urquhart Shale (20 S)
Overburden (15 S)
Y
X
Urquhart
Shale
-
top (20 S)
Z
Urquhart Shales
West Contact (10 S)
Fine grained pyrite (2000 S)
Paroo fault (10 S)
Off-hole
targets (3000 S)
0
~500
Metres
1400
1600
1800
2000
Fine-grained
pyrite (3000 S)
2200
Secondary field
continuously
normalised
(%)
Secondary field
continuously
normalised
(%)
180
180
Observed
Calculated
160
160
120
120
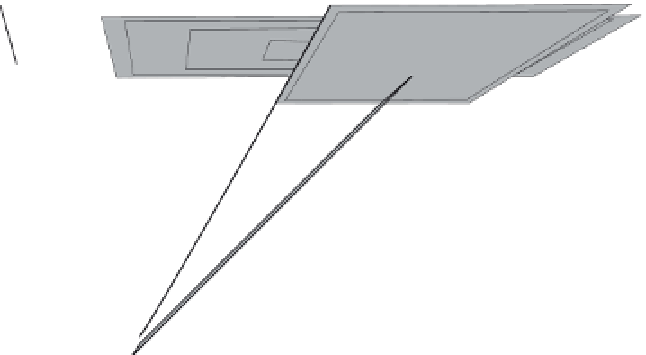
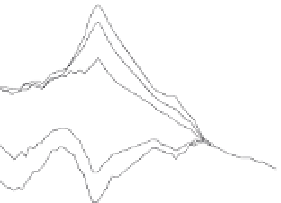
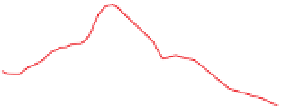
Figure 5.93
Presentation of DHEM data in 3D as used for
data modelling. The locations of conductors relative to the
drillhole trajectory are shown along with the observed and
calculated data. Data are from the Mount Isa Cu mine.
80
80
40
40
0
0
1400
1600
1800
2000
2200
1400 1800
Downhole depth (m)
1600
2000
2200
-40
-40
Downhole depth (m)
-60
-60
with well-coupled conductors close to the drillhole produ-
cing particularly strong responses. The measurements may
also include complex responses due to closely spaced and
interacting conductors, and artefacts due to deviations in
the drillhole trajectory (probe orientation changing). Inter-
pretation proceeds by identifying the responses of in-hole
and off-hole conductors (see
Section 5.8.2.1
). A series of
computed downhole profiles for all three components from
one or more drillholes located at various locations around
and intersecting a model conductor is an essential inter-
pretation aid.
component show symmetry and change in polarity around
the conductor. The distribution of the current flow in the
conductor depends on the size, shape and orientation of
the induced current system at any particular delay time
(see
Section 5.7.1.4
). For in-hole conductors the responses
vary according to whether the drillhole has intersected the
central region of the conductor or its edge, because this
means the hole is in a different location relative to the
migrating eddy currents.
Based on the relationships between component
responses and their polarities, the location, orientation
and size of the source conductor with respect to the drill-
hole can be interpreted. The computed model responses
shown in
Fig. 5.94
illustrate the key characteristics of the
axial (A) and radial (U) component responses (see
Section
surface transmitter loop located directly above a horizontal
finite thin plate conductor. The direction of U is ambigu-
5.8.2.1
In-hole and off-hole responses
Conductors detected by DHEM are classi
ed as either in-
hole conductors, those intersected by the drillhole, or off-
hole conductors, those located away from the drillhole. The
three-component response is diagnostic of these two
classes and their identi
cation is fundamental in the inter-
pretation of DHEM data (
Fig. 5.94
). Profiles of each


Search WWH ::

Custom Search