Geoscience Reference
In-Depth Information
S
N
High
-800
0
800
1600
0
200
Resistivity
a)
Apparent resistivity
Metres
Low
n
=1
n
=2
n
=3
n
=4
n
=5
n
=6
Ground surface
n
=1
n
=3
n
=5
n
=7
-800
0
800
1600
Raw phase
n
=1
n
=2
n
=3
n
=4
n
=5
n
=6
Dipole-dipole
n
=1
n
=3
n
=5
n
=7
-800
0
800
1600
Pole-dipole
Decoupled phase
n
=1
n
=2
n
=3
n
=4
n
=5
n
=6
b)
Ground surface
-800
0
800
1600
n
=1
n
=3
n
=5
n
=7
0
500
Metres
Dipole-dipole
Clastic sediments
Shales
Reef facies limestone
Platform facies limestone
Mineralisation
Faults
n
=1
n
=3
n
=5
n
=7
Low
High
Pole-dipole
Resistivity
IP
High
Low
c)
Equipotential surface
Ground
surface
Figure 5.59
Dipole
dipole array resistivity/IP data and geological
data from the Goongewa Pb
-
Current flow line
-
Zn deposit. The data demonstrate the
effects of EM-coupling in phase data and the actual IP response of
the ground resolved in the decoupled data. Redrawn, with
permission, from Scott et al.(
1994
).
Current
dispersion
Current
focusing
the dipole spacings, laying out the transmitter dipole cables
well away from the receiver dipole cables, orienting the
current and potential dipoles perpendicular to each other
(not possible for the conventional in-line arrays); in the
frequency domain reducing the frequency of the transmit-
ted current and in the time domain increasing the primary
polarisation time. Of course, not all of these can be
achieved without jeopardising other survey parameters,
such as depth of investigation and lateral resolution.
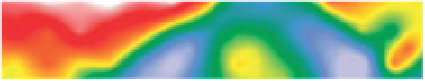
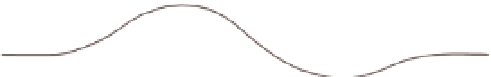
Figure 5.60
The computed dipole
-
dipole and pole
-
dipole array
resistivity responses of topographic variations on a homogeneous
subsurface. (a) For a valley; (b) for a hill. Horizontal scale is one
dipole length per division. c) Distortions of horizontal current
flow and associated equipotential surfaces due to topographic
variations.
however, are less affected. For surface arrays such as the
gradient and Schlumberger arrays, potential measurements
are made inside the current dipole where the equipotential
surfaces are generally vertical, so the current flow is gener-
ally horizontal and parallel to the surface. Hills cause the
equipotential surfaces, and the current
5.6.7.3
Topographic effects
Apparent resistivity calculations based on
Eq. (5.17)
assume
that the electrode array is located on a
flat survey surface.
Departures from this assumption, when electrodes are
located on undulating topography and man-made disturb-
ances to the terrain, create spurious variations in resistivity
(Fox et al.,
1980
).
flow, to diverge, and
valleys cause them both to converge (
Fig. 5.60c
). The dis-
tortion in the equipotential surfaces produces variations in
the measured potentials unrelated to variations in the sub-
surface electrical properties. Valleys produce high apparent
resistivity and hills have the opposite effect. The effects of
Induced polarisation parameters,


Search WWH ::

Custom Search