Geoscience Reference
In-Depth Information
SSE
NNW
W
E
a)
a)
0
200
400
600
2000
2800
3600
4400
5200
6000
Apparent resistivity
Apparent resistivity
n
=1
n
=2
n
=3
n
=4
n
=1
n
=2
n
=3
n
=4
n
=5
n
=6
0
200
400
600
Apparent chargeability
n
=1
n
=2
n
=3
n
=4
2000
2800
3600
4400
5200
6000
Apparent chargeability
b)
0
200
400
600
n
=1
n
=2
n
=3
n
=4
n
=5
n
=6
0
50
100
150
Resistivity
0
200
400
600
b)
0
2800
3600
4400
52
0
0
0
50
100
100
150
200
Chargeability
300
Resistivity
c)
0
200
400
600
2800
3600
4400
52
0
0
0
100
200
300
Chargeability
Low
High
0
100
Resistivity
Polarisation
c)
Metres
2000
2800
3600
4400
5200
6000
High
Low
Overburden
Mafic-intermediate intrusives
Intermediate-mafic volcanics
Felsic volcanics
Orebody
0
200
Low
High
Metres
Induced
polarisation
Resistivity
>5% Pb+Zn
High
Low
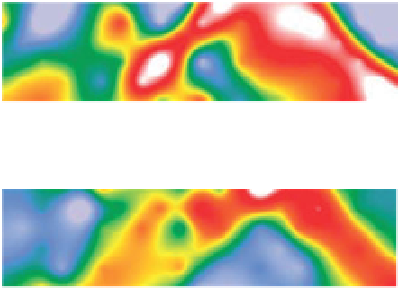
Figure 5.54
Dipole
122 m)
resistivity/IP data from the Red Dog massive sulphide deposit.
Pseudosections of (a) the survey data and (b) the inversion models.
(c) The geological section. See text for details. Based on diagrams
in Van Blaricom and O
-
dipole array (dipole length
¼
Figure 5.53
Pole
-
dipole array (dipole length
¼
50 m) resistivity/IP
data from the Estrades massive sulphide deposit. Pseudosections
of (a) the survey data and (b) the inversion models. (c) The
geological section. See text for details. Based on diagrams in Bate
et al.(
1989
).
'
Connor (
1989
).
Figure 5.55
shows frequency domain data acquired
using the dipole
dipole array. Measurements of the phase
polarisation parameter were made at multiple frequencies
to allow removal of EM-coupling effects (see
Section
casing but the data presented here were not overly affected.
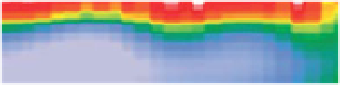
The phase data show a deep, broad, positive response
impinging the lower n values, indicating that depth to the
top of the source is about one dipole length, i.e. 400 m. The
apparent resistivity data show a more focused anomaly, but
again appearing in the shallowest part of the pseudosec-
tion. Inversion of these data de
ned a broad conductive
body closely coincident with the Olympic Dam Breccia
Complex. Depth to the top is accurately predicted by the
-
Example - Olympic Dam iron oxide copper gold deposit
The giant Olympic Dam Cu
Ag and rare-earth-
elements deposit, in South Australia, is located in a hydro-
thermal breccia complex beneath several hundred metres of
unmineralised Proterozoic sedimentary rocks (Reeve et al.,
text of a conceptual geological model, led to its discovery.
Resistivity/IP surveys were trialled after discovery; selected
data are presented here as examples illustrating responses
from a very deep target under overburden. The most com-
prehensive description of geophysical surveys at Olympic
Dam is provided by Esdale et al.(
2003
).
-
U
-
Au
-


Search WWH ::

Custom Search