Geoscience Reference
In-Depth Information
a)
A
B
C
G
G
E
C
G
b)
C
B
G
A
C
C
B
A
C
A
G
A
C
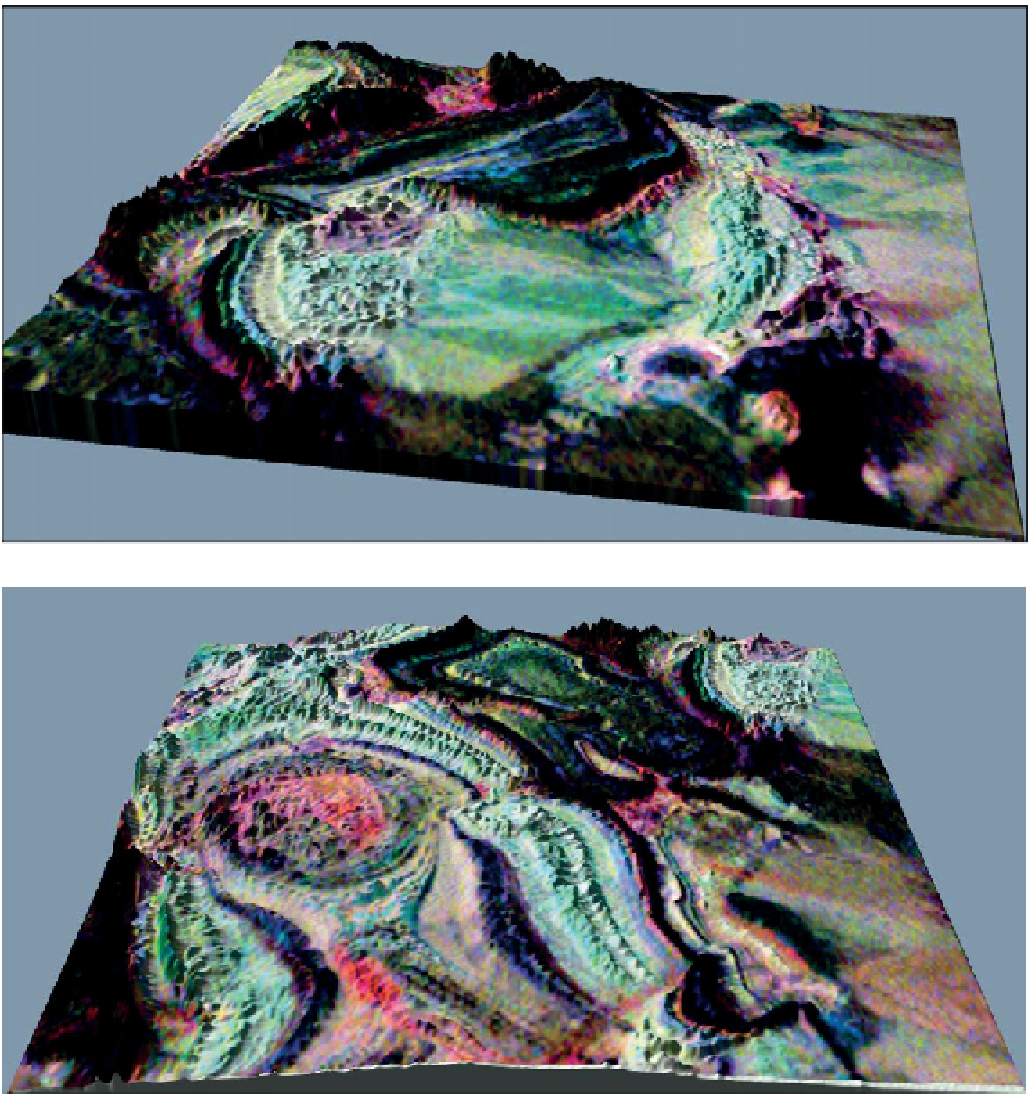
Figure 4.27
Subsets of the radiometric data in
Fig. 4.26
draped on terrain models produced from the Shuttle Radar Topography Mission (Farr
andesites. Strong responses are associated with most of the
deposits in the region. The K/eTh data (
Fig. 4.25f
) is less
affected by lithological variations and by factors such as
vegetation. A broad area of higher ratio coincides with the
main zone of subdued magnetic response extending from
the Mataura area to the Sovereign area. Elsewhere, the
correlation is not as good but there is also a zone of higher
values coincident with the anomalous magnetic response
surrounding the Waihi deposit. Individual deposits may
coincide with very high K/eTh values, for example the
Waihi and Wharekirauponga deposits, owing to the
intense K metasomatism at the centre of the hydrothermal
alteration zones.
4.7.3.3
Host rocks
Mapping K, eU and eTh concentrations and their relative
abundances, as assessed from their various ratios, can also
be useful for locating favourable host rocks for mineral-
isation. The anomalous absolute and relative concentra-
tions of U and Th in kimberlites and carbonatites (see
for commodities associated with these rock types. In some


Search WWH ::

Custom Search