Geoscience Reference
In-Depth Information
e)
Y
Y'
Y
Y'
0
0
200
200
400
400
600
600
0
200
Metres
0
200
Metres
800
800
1000
1000
Unconstrained
Constrained
Y
Y'
0
200
1.0
0.1
0.01
0.001
400
600
0
200
Metres
Susceptibility
(SI)
800
1000
Observed
f)
Z
= 200 m
Z
= 200 m
Z
= 200 m
Observed
Y'
Unconstrained
Y'
Constrained
Y'
0
200
Metres
0
200
Metres
0
200
Metres
Y
Y
Y
Z
= 400 m
Z
= 400 m
Z
= 400 m
Observed
Unconstrained
Constrained
Y'
Y'
Y'
0
200
Metres
0
200
Metres
0
200
Metres
Y
Y
Y
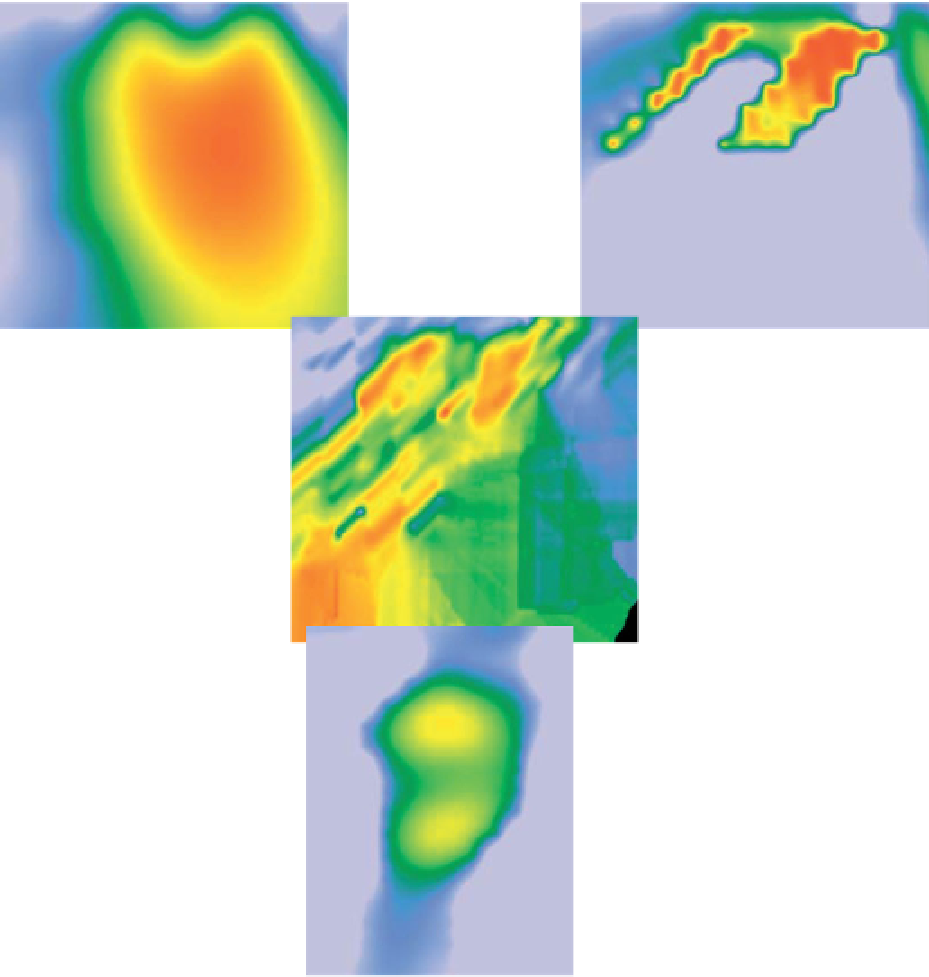
Figure 3.71
(cont.) the cross-sections and depth slices, respectively, shown in (e) and (f). (e) Observed and modelled susceptibility distributions
along cross-sections below Y
-
Y
0
. (f) Observed and modelled susceptibility distributions along depth slices 200 and 400 m below the surface.
The dashed lines in (e) and (f) represent the limits of reliable subsurface susceptibility data. Magnetic and susceptibility data reproduced
with the permission of Barrick (Australia Pacific) Ltd. Susceptibility model created and supplied by Mines Geophysical Services. Euler
deconvolution by Cowan Geodata Services.


Search WWH ::

Custom Search