Geoscience Reference
In-Depth Information
a)
Sandstone
n
= 470
Amphibolite
n
= 54
Density
1.5
2.0
Density (g/cm
3
)
2.5
3.0
3.5
1.5
2.0
Density (g/cm
3
)
2.5
3.0
3.5
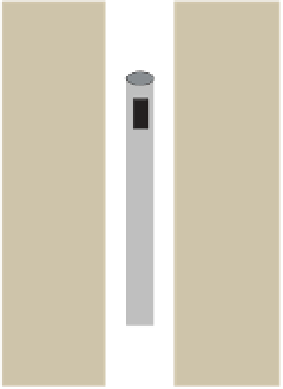
Detector
Granite
n
= 371
Gneiss
n
= 135
Depth assigned
to measurement
1.5
2.0
Density (g/cm
3
)
2.5
3.0
3.5
1.5
2.0
Density (g/cm
3
)
2.5
3.0
3.5
Compton
scattering
Source of
radiation
Graphitic schist
n
= 743
Kimberlite
n
= 375
Photoelectric
absorption
1.5
2.0
Density (g/cm
3
)
2.5
3.0
3.5
1.5
2.0
Density (g/cm
3
)
2.5
3.0
3.5
b)
c)
Density (g/cm
3
)
Density (g/cm
3
)
Figure 3.38
Frequency histograms of density for various lithotypes.
2.0
3.0
4.0
1.0
2.0
3.0
80
40
distributions, and alteration may lead to several sub-
populations (
Fig. 3.35
). Sedimentary rocks tend to have
the most complicated distributions re
ecting variations in
composition and, in particular, porosity.
100
60
Pb-Zn
Pyrite
120
80
3.9
Magnetism in the geological
environment
140
100
An understanding of the magnetism of the geological
environment and geological causes for variations in mag-
netism is crucial for making geologically realistic interpret-
ations of magnetic data.
The magnetism of rocks depends on the magnetic prop-
erties of their constituent minerals. Rock magnetism varies
far more than density with susceptibility varying by
approximately
160
120
Tuff
Dolerite
Greywacke
Argillite
Sulphides
Interbedded sandstone & shale
Sandstone
Shale
Coal
five orders of magnitude in the common
rock types. The most fundamental control on rock magnet-
ism is iron content. Put simply, without iron magnetic
minerals cannot form, but not all iron-minerals are strongly
magnetic. Magnetic minerals may be formed in the primary
igneous environment, others may be created by secondary
processes such as metamorphism. They all may be des-
troyed by secondary processes, notably weathering.
Unlike density, rock magnetism is not a bulk rock prop-
erty. Instead it depends on mineral species that usually
comprise only a few per cent by volume of a rock
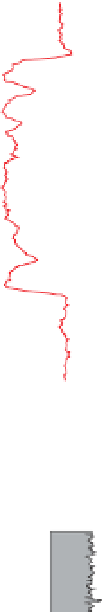
Figure 3.37
Downhole density logs. (a) Schematic illustration of
gamma
gamma density logging, redrawn, with permission, from
-
-
Ag
-
Au VMS deposit, New Brunswick, Canada. Based on a diagram
Based on diagrams in Renwick (
1981
).
-
Pb
-
Cu
of samples of lithotypes that are resistant to erosion, and so
outcrop.
Figure 3.38
shows frequency histograms for various
lithologies. Generally, they are roughly symmetrical and
have a single mode. The distribution for the granite is
typical, being rather narrow. Basalts tend to have broader
'
s miner-
alogy. Magnetic mineralogy is often strongly affected by
subtle changes in geochemistry and secondary processes,


Search WWH ::

Custom Search