Geoscience Reference
In-Depth Information
and
own north
south in a racetrack pattern (see
Section
stages of reduction,
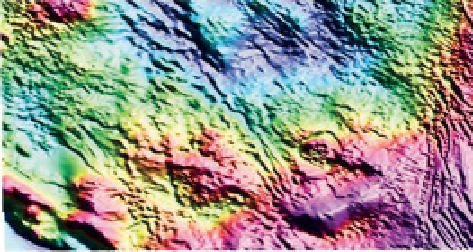
Fig. 3.24a
being the data after removal
of the IGRF and heading effects. Corrugations parallel to
the survey line direction, due to errors, are obvious. They
are greatly reduced by correcting for diurnal variations
measured at the base station (
Fig. 3.24b
)
and are almost
totally removed after tie-line levelling (see
Section 3.6.4
)
(
Fig. 3.24c
). The application of microlevelling attenuates
some residual short-wavelength features to improve the
overall appearance (
Fig. 3.24d
), for example by improving
the continuity of linear anomalies in the southeast of the
dataset, and improving the clarity of detail throughout.
-
0
20
Kilometres
a)
b)
3.7
Enhancement and display of gravity
and magnetic data
The interpreter
s ability to analyse gravity and magnetic
data can be greatly assisted by various
'
filters that empha-
sise particular characteristics of the data, or suppress
undesirable characteristics. The methods used on magnetic
and gravity data are similar since the appropriate
filtering
techniques are based on the physics of potential
fields.
They may be applied to 1D pro
les of data, for example
individual
flight lines of an aeromagnetic survey; but
working with 2D gridded data is more common.
applied to gravity and magnetic data. Only those
filtering
operations specific to these kinds of data are described
here, and then we focus only on the most commonly used
of a vast number of potential-field filters. A comprehensive
summary of potential-field filtering operations, as applied
to magnetic data, is provided by Milligan and Gunn
(
1997
). In order to demonstrate the various filters we
have computed their effects on the gravity and magnetic
responses of a square prism with vertical sides (
Figs. 3.25
and
3.26
) and have also applied them to actual gravity and
TMI datasets.
of the Las Cruces Cu
c)
d)
Figure 3.24
Removal/attenuation of unwanted artefacts at different
stages of the reduction of aeromagnetic data acquired along north
-
south survey lines. All images are TMI (in pseudocolour) with
shaded relief illuminated from the northeast (as a grey-scale). (a)
Data corrected for aircraft orientation and compensated for IGRF;
(b) the data in (a) with base-station-recorded diurnal variations
removed; (c) the data in (b) after tie-line levelling; and (d) the data in
(c) after microlevelling. The grey circles show the ends of the east
Au volcanogenetic massive sulphide
deposit, located in the Iberian Pyrite Belt near Seville,
Spain. Mineralisation occurs below 150 m of Tertiary sedi-
ments and comprises massive to semi-massive sulphides
underlain by a pyritic stock work. Host rocks are volcani-
clastics and black shales. The geophysical characteristics of
geology by Doyle et al.
2003
. The deposit is associated with
a roughly circular positive gravity anomaly with amplitude
-
-
west tie lines. The prominent circular feature in the right centre of
the images is an astrobleme. Data reproduced with the permission of
the Northern Territory Geological Survey.


Search WWH ::

Custom Search