Geoscience Reference
In-Depth Information
-
7400
gu
-
8700
a)
2400
gu
700
b)
Data before height corrections
-
6360
gu
Free-air correction
-
6470
c)
2950
-
gu
3650
-
d)
Free-air anomaly
-
2130
gu
Bouguer correction
-
2320
e)
115
gu
30
f)
Partial Bouguer anomaly
-
2100
gu
Terrain correction
-
2270
g)
Complete Bouguer anomaly
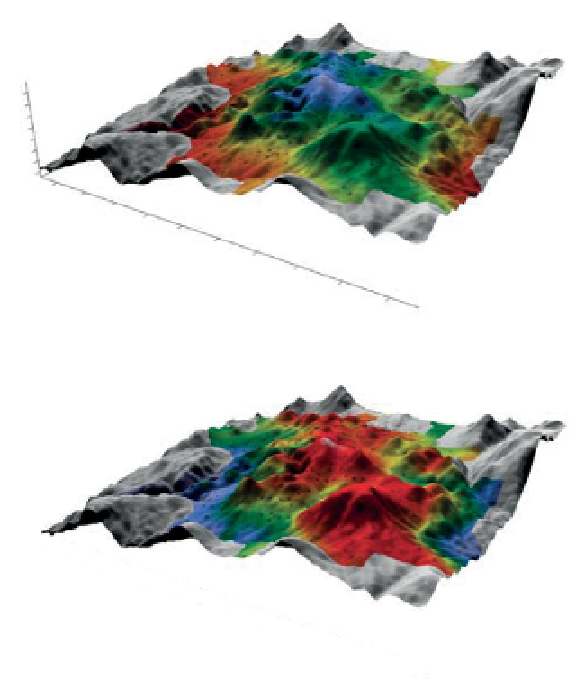
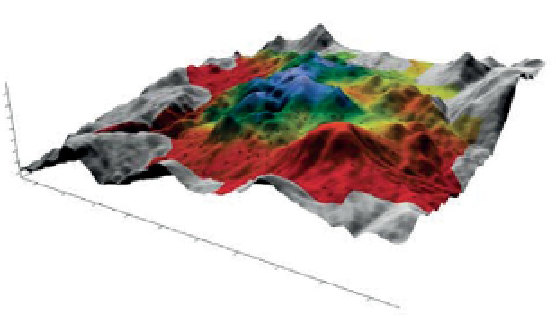
Figure 3.19
Height and terrain corrections applied to gravity data from Cripple Creek. The grey surface is topography, which has an
average elevation of around 3000 m and a variation of more than 800 m. The pseudocolours correspond with (a) observed gravity corrected
for tidal, drift and latitude effects, (b) free-air corrections, (c) FAA, (d) Bouguer corrections, (e) partial BA, (f) terrain corrections and
(g) complete BA. The images were created from open-
le gravity and digital terrain data obtained from the United States Geological Survey.


Search WWH ::

Custom Search