Geoscience Reference
In-Depth Information
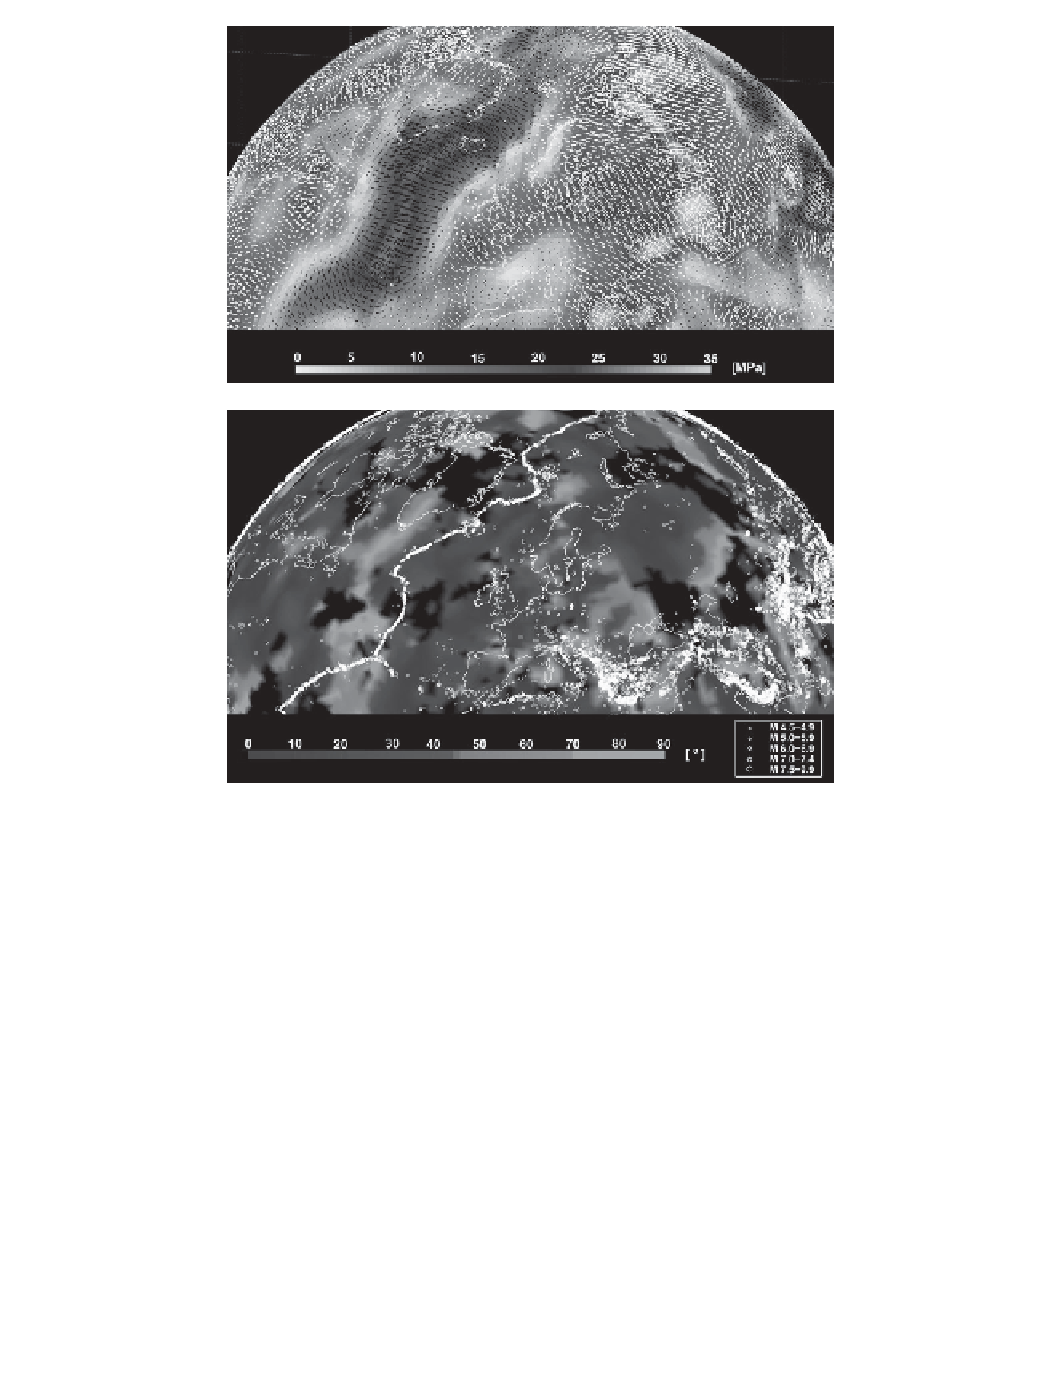
(a)
(b)
Figure 10.2 Lithospheric stress from potential energy variations. (a) Principal horizontal stress
(white is extension and magenta is compression, relative to the lithostatic state of stress, where
vector length represents stress magnitude) on a background of effective stress (i.e., the square root
of the second invariant of the deviatoric stress tensor; e.g., Ranalli,
1995
)
in MPa (colour bar). (b)
Difference between model predicted and observed principal stress directions (Heidbach
et al
.,
2007a
,
greater than or equal to 4.5 earthquake epicentres since 1973 taken from the National Earthquake
Information Centre. For color version, see Plates section.
explanation could be that in the North Atlantic realm it is lithospheric potential energy and
radial mantle tractions that exert the governing control on geopotential stresses. Indeed, we
find that the combined stress field from radial tractions and lithospheric structure agrees
better with the observed stress directions (Global Stress Map; Heidbach
et al
., 2007) than
if each source is considered individually.