Geoscience Reference
In-Depth Information
a
Japan Sea
Mainshock
Pacific Ocean
Fa
F14
Fb
F15
F16
km
0
5
M6
M4
M2
0
2
4 6 8 10 12 14
Depth (km)
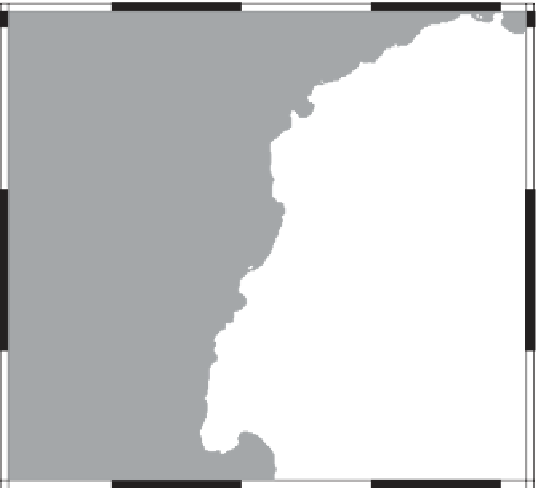
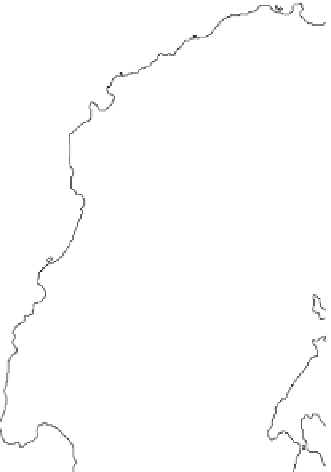
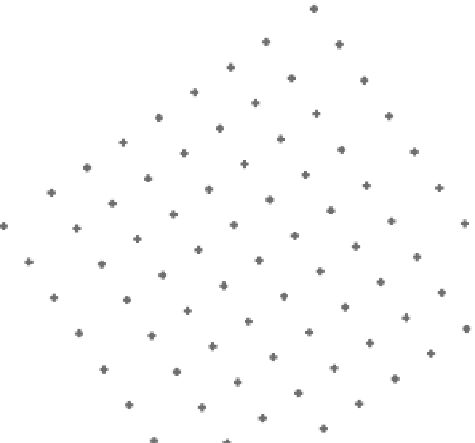
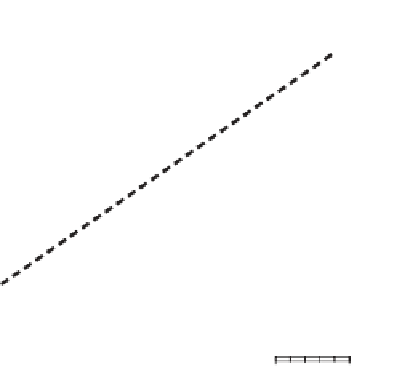
Figure 9.7 Dense seismic observations and
V
p
model in the source area of the 2007 Noto-Hanto
earthquake (modified after Kato
et al
., 2008b). (a) Map of the relocated aftershock hypocenters
with the circle size scaled to earthquake magnitude and tones scaled to depth. The star denotes
the epicenter of mainshock. The inset indicates the location of the area investigated with moment
tensor for the mainshock (NIED). Filled triangles and squares denote temporary seismic stations and
online stations, respectively. Open squares are temporary online stations operated by the Japanese
University Group of the Joint Seismic Observations at NKTZ (2005). The grid used in the tomography
is shown by crosses. Active (F14-F16) and geological faults (Fa, Fb) associated with the present
earthquake are drawn as thick solid lines, and the other major active faults are drawn as thin solid
lines.
9.4.1 Aftershock distribution and pre-existing structures within ancient rift system
the fault strike along relocated aftershocks within
1.5 km of the section. Based on the
aftershock distributions, it is estimated that the mainshock occurred on the approximately
55
±
southeastward-dipping plane. Surface extension of the mainshock fault roughly cor-
responds to the surface traces of several active faults beneath the ocean (F14-F16) and a
°