Geoscience Reference
In-Depth Information
W35N
E35S
MUKF
300
0
0
0
0
0
0
Y = 0 km
5
5
5
5
5
WD
ED
C
B
10
10
10
10
10
A
-10
-10
-10
-10
-10
-5
-5
-5
-5
-5
0
0
0
0
0
5
5
5
5
5
Cross-section X (km)
M1
M1
M2
M2
234567
Vp (km/s)
2004
2005
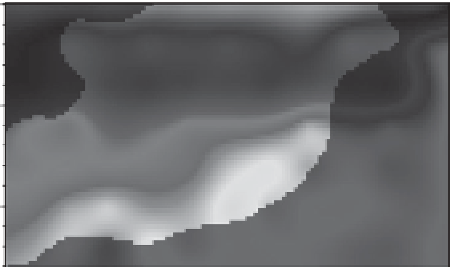
Figure 9.3 Depth section through the
V
p
model obtained at the southwest edge of the source area
of the 2004 Chuetsu earthquake, with superimposed relocated aftershocks distributed within
±
4km
from the section (light gray circles observed in 2004, and dark gray circles in 2005) (Kato
et al
.,
2010b
)
. Masked areas correspond to low model resolution. White curves denote iso-velocity contours
of
V
p
=
5.7 km/s, and white broken lines show faults suggested from aftershock alignments and the
top surface geometries of the basement. Three tilted blocks are labeled as A, B, and C. Eastward- and
westward-dipping alignments of aftershocks near the top surface of the basement are indicated by
black (ED) and white (WD) arrows. The top figure shows a topography variation along the profile.
Gray lines correspond to the three plateaus in the topography.
reverse faults under compression. Indeed, the NW-dipping fault planes with high dip angles
NW-dipping faults are mechanically weak.
between the two source areas extends continuously for over 20 km from south to north. The
azimuth of the DCT filled with thick sediments lies almost parallel to the surface traces
of major active faults and fold axes. In contrast, remarkable high-velocity bodies (
V
p
=
5 km) and the source
region of the 2007 earthquake (deeper than 15 km, in
Figures 9.2b
and
9.4b
)
. As a result,
the velocity gradient of
V
p
with depth is very steep at the DCT. We consider that the DCT
corresponds to the Miocene rift axis, because the dominant dip direction of each tilted
6.8-7.1 km/s) are imaged beneath the DCT (
−
15 km
<
X
<
−