Geoscience Reference
In-Depth Information
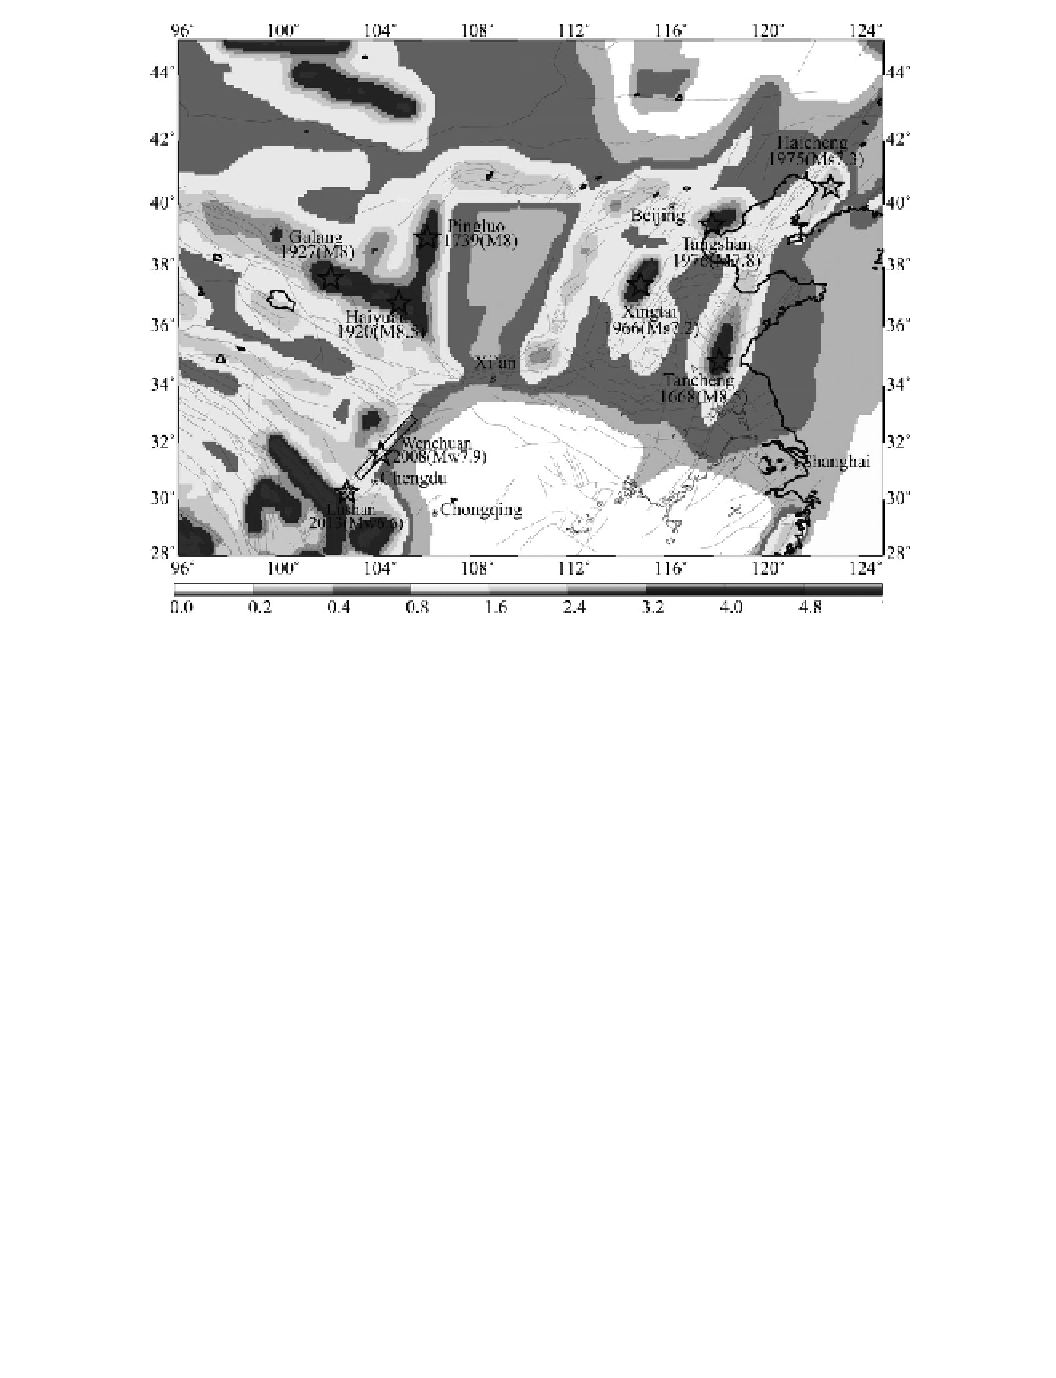
Figure 5.10 Seismic hazard map for North China and surrounding regions (GSHAP, 1999,
http://
www.seismo.ethz.ch/static/GSHAP
)
. The hazard is expressed as the peak ground acceleration (PGA)
on firm rocks, in m/s
2
, expected to be exceeded in the next 50 years with a probability of 10%.
The epicenters and rupture zones of the 2008 Wenchuan earthquake (Mw 7.9) and 2013 Lushan
earthquakes (Mw 6.6) are indicated by stars and rectangles, respectively. For color version, see Plates
section.
large earthquakes roamed between widespread fault systems; in the past 2,000 years, not a
singleM
7.0 earthquake ruptured the same fault segment twice. Such earthquake behavior
raises questions about hazard maps such as that in
Figure 5.10
.
Since the publication of this
hazard map in 1999, a number of large earthquakes have occurred in this region, providing
opportunities to test this assessment. Unfortunately, the map failed the test.
The devastating 2008 Wenchuan earthquake (Mw 7.9), which killed
90,000 people,
was not expected by the map maker (
Figure 5.10
)
. This earthquake ruptured the central
and northern segments of the Longmenshan fault, which was assigned a moderate to low
risk by the hazard map, presumably because of the low fault slip rates (
<
3 mm/yr) and
the lack of large earthquakes in the past few centuries. The high risk zones on the map
are where large earthquakes occurred in the recent past, such as along the Xianshuihe
fault. Five years after the Wenchuan earthquake, the 2013 Lushan earthquake (Mw 6.6)