Geoscience Reference
In-Depth Information
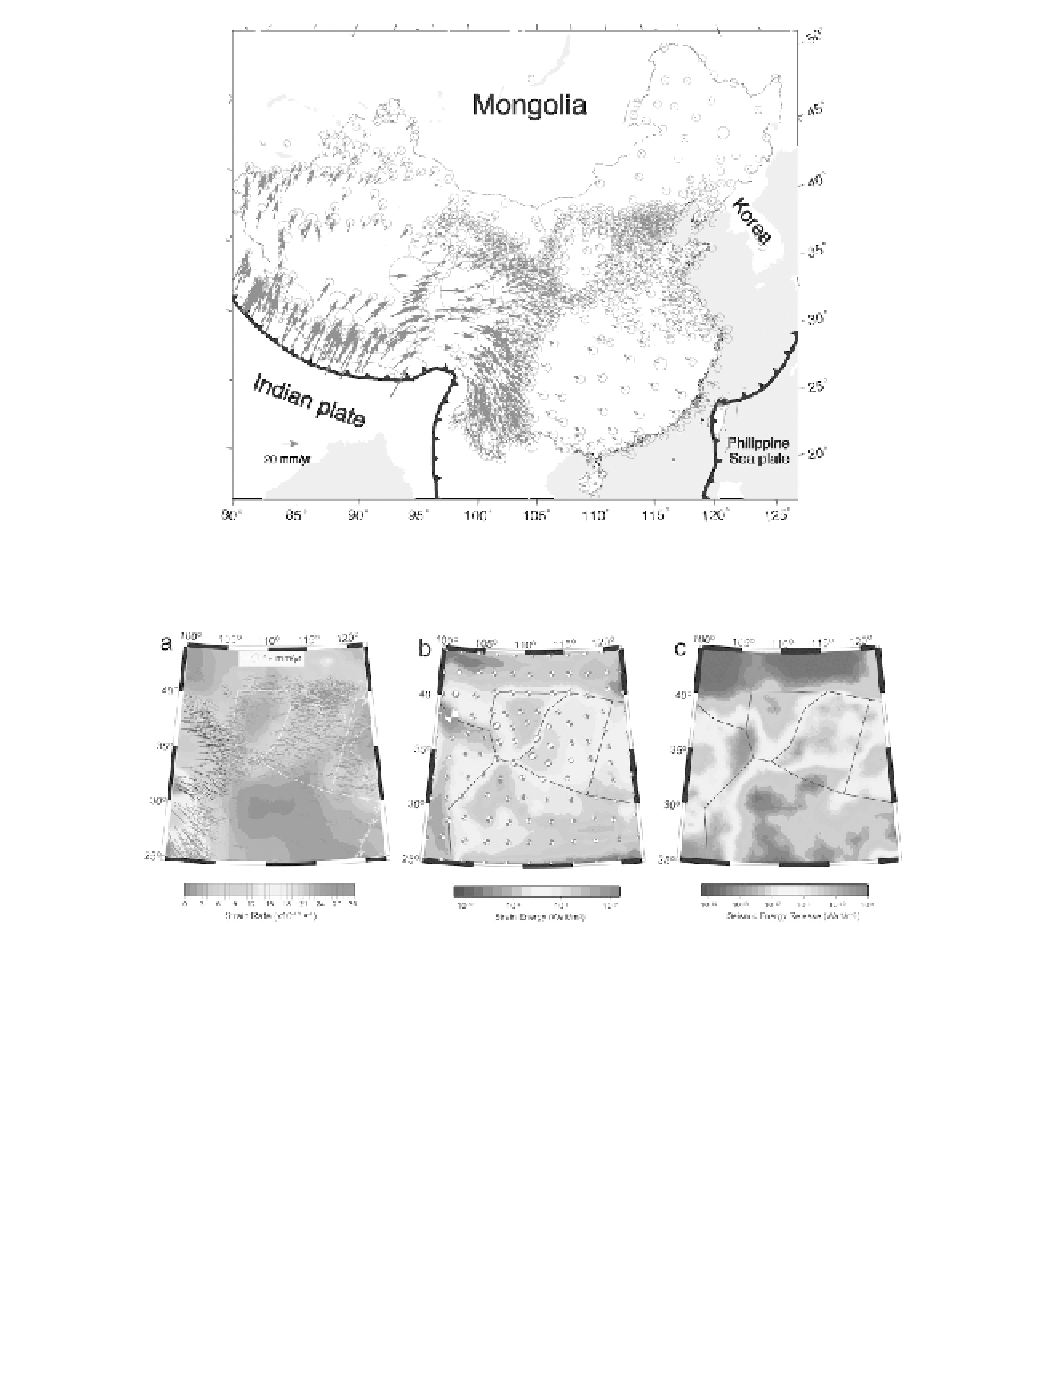
Figure 5.4 GPS site velocities in mainland China relative to stable Eurasia. Data from Zhang and
Figure 5.5 (a) GPS velocity (relative to stable Eurasia) and strain rates (background). (b) Predicted
long-term strain energy (background) and stress states represented in sterographic lower-hemisphere
projections. (c) Seismic strain energy released in the past
2,000 years. Modified from Liu and Yang
Using the velocity boundary conditions extrapolated from the GPS data, Liu and Yang
strain rate and strain energy (the product of scalar strain rate and stress) in North China
(
Figure 5.5b
)
. The spatial pattern of strain energy is comparable with seismic moment
release in the past
2,000 years, estimated using the Chinese historic catalog (
Figure 5.5c
)
.