Geoscience Reference
In-Depth Information
3
2
1
0
-1
-2
35
34
33
32
31
17
16
15
14
535
530
525
520
515
11.0
11.2
11.4
11.6
11.8
12.0
Time (hoursUTC)
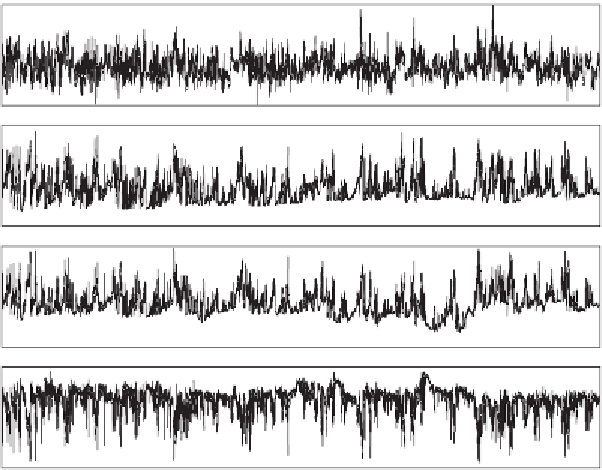
Figure 3.4
One hour of turbulence: instantaneous observations of vertical wind (
w
),
temperature (
T
), speciic humidity (
q
) and speciic CO2 concentration (
q
CO2
). Obser-
vations made in Ghana over savannah (October 2001).
base level is related to the mean concentrations in the well-mixed part of the daytime
convective ABL (see
Figure 3.1
and Graf et al.,
2010
).
3. The larger (and longer lived) deviations from the mean seem to occur simultaneously for
all variables: a positive vertical wind luctuation coincides with positive luctuations in
temperature and humidity and a negative luctuation in CO
2
: so different quantities are
mutually correlated.
The last of the aforementioned remarks is in fact the engine that vertically transports
heat, gases (water vapour and CO
2
) and horizontal momentum.
Figure 3.5
shows a
sketch of the engine of vertical turbulent transport. The surface injects a certain amount
of heat into the atmosphere (surface sensible heat lux
H
), and the turbulent motion of
air removes that heated air from close to the surface to higher levels, whereas (cooler)
air from above replaces the removed air. If this eficient transport mechanism were not
present, the air close to the ground would heat up tremendously. Likewise, the surface
extracts momentum from the air (slows down the low) and turbulence replenishes this
from higher levels. Turbulent transport is discussed further in
Section 3.4
.
Question 3.2:
Make a sketch similar to
Figure 3.5
for the following transports (assign
the correct labels and directions to the three arrows):
a) Negative sensible heat lux
b) Positive evaporation


Search WWH ::

Custom Search