Geoscience Reference
In-Depth Information
200
25
night
day
(a)
(b)
150
20
100
15
50
10
0
5
-50
-100
0
0 36912
15
18
21
24
5
10
15
20
25
30
35
40
Potential temperature(
◦
C)
Time (UTC)
1000.0
25
(c)
z
=0.3 m
z
=1.3 m
z
=6m
z
=15m
(d)
100.0
20
10.0
15
1.0
10
0.1
5
night
day
0.01
0.001
0
0 36912
15
18
21
24
0.001
0.01
0.1
1.0
10.0
100.0
Tu rbulent diffusivity(m
2
s
-1
)
Time (UTC)
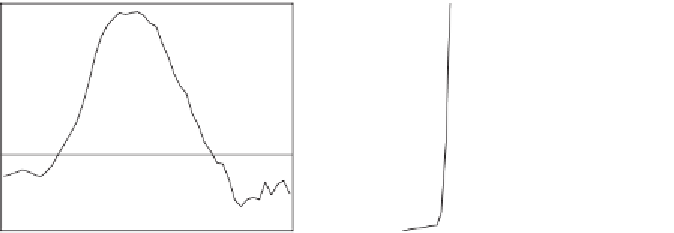
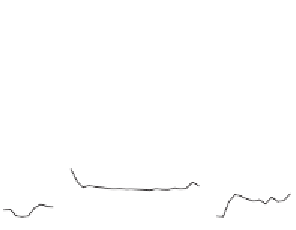
Figure 3.3
Temperature and turbulent diffusivity for heat as derived from observa-
tions at Cabauw (The Netherlands). (
a
) Diurnal variation of surface sensible heat
lux. (
b
) Proile of potential temperature (night: 2:00-2:30, day: 12:30-13:00). (
c
)
Time series of
K
h
at four heights. (
d
) Proiles of
K
h
during night time and daytime.
(Data courtesy of Fred Bosveld, KNMI)
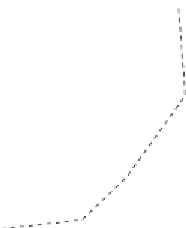
Question 3.1:
Figure 3.3d
shows the turbulent diffusivity for heat transport for a night
time period and a daytime period. It is clear that the diffusivity increases with height.
But because
K
h
has been plotted on a logarithmic axis (to accommodate the large spread
in values), the
exact
dependence of
K
h
on height
z
cannot be determined.
a) Create a table of values for
K
h
for a number (say four) of heights, for daytime and
night time separately.
b) Deduce from those values whether
K
h
increases with height in a linear fashion (i.e.,
K
h
~
z
), more than linearly (e.g.,
K
h
~
z
1.5
), or less than linearly (e.g.,
K
h
~
z
0.5
). Do
this for night time and daytime separately. Note that the exact power is not of inter-
est, only if the increase is stronger or weaker than linear. The answer will become
relevant again in
Section 3.5.5
. Hint: determine for each height interval
∂
∂
K
z
h
; from
the height dependence of
∂
∂
K
z
2
(so in fact from
∂
∂
K
z
h
h
) one can determine whether
2
K
h
varies more than linearly or less than linearly with height.


Search WWH ::

Custom Search