Geoscience Reference
In-Depth Information
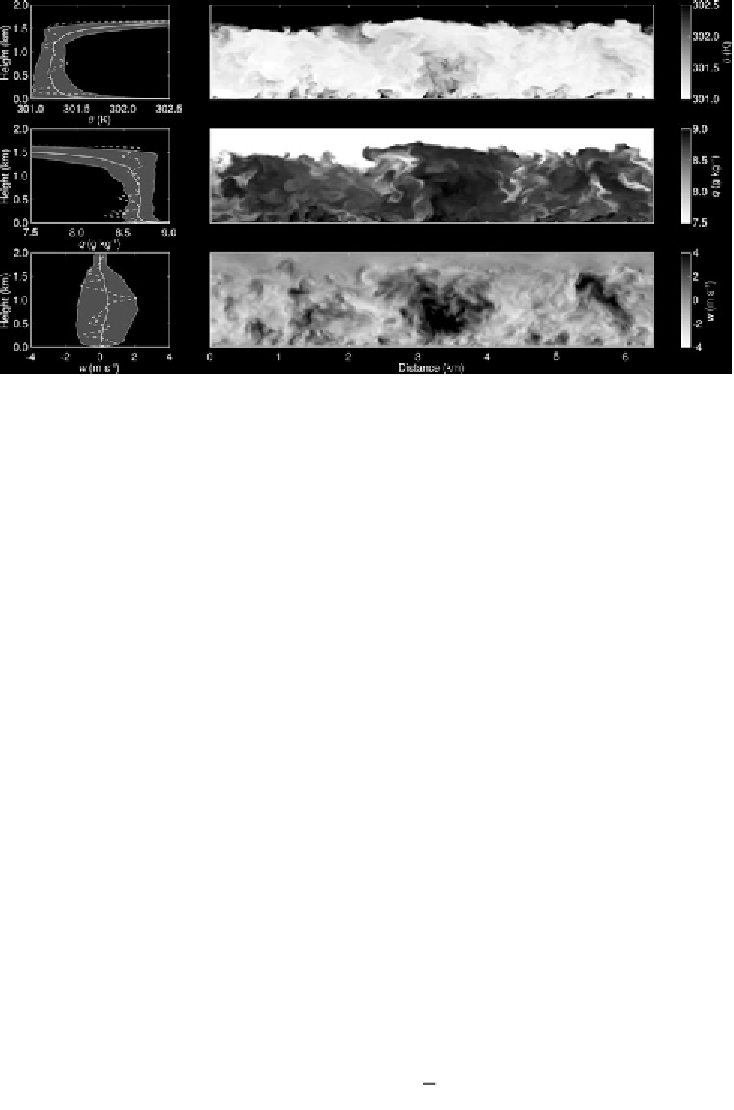
Figure 3.2
Vertical cross section through a convective boundary layer: potential tem-
perature (top), speciic humidity (middle) and vertical wind speed (bottom). Proiles
at the left show mean proiles (averaged over the cross section shown) and the shading
indicates deviations of one standard deviation around the mean. Also shown are the
instantaneous proiles at one location (dashed line). Fields originate from a large eddy
simulation (LES) with the Dutch Atmospheric LES (DALES; see Heus et al.,
2010
).
In the forthcoming sections we irst explore the characteristics of the turbulent
diffusivity that would be needed to relate a turbulent lux to a gradient. Then various
ways of characterizing turbulence are dealt with in
Section 3.3
. Next the transporting
properties of turbulence are dealt with in
Section 3.4
, including the reference tech-
nique to measure turbulent luxes, viz. the eddy-covariance method. The framework
of similarity relationships is developed in
Section 3.5
and used to derive luxes from
mean turbulent quantities in
Section 3.6
. In
Section 3.7
a summary of this chapter is
given, including a concept map. It may be useful, while reading through this chapter,
to consult regularly the concept map in
Figure 3.22
. Note that
Appendix B
reiterates
some basic thermodynamics, gives an overview of various properties of air and lists a
range of measures for the amount of water vapour in the air.
3.2 Characteristics of Turbulent Diffusivities
Before dealing with turbulence in more detail, we irst examine some characteristics
of turbulent transport. As an example we look at the transport of heat. Inspired by Eq.
(
1.6
), we can deine a turbulent diffusivity that links the lux of sensible heat to the
vertical gradient of the mean temperature:
T
z
∂
∂
F
≡−
ρ
p
c K
(3.1)
h
h
Search WWH ::

Custom Search