Geoscience Reference
In-Depth Information
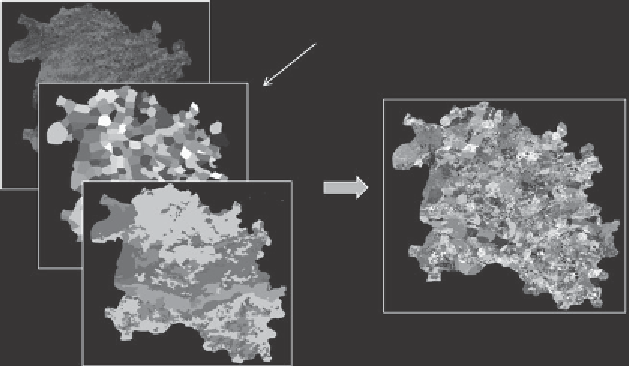
Per village information on canal water supply,
groundwater levels and groundwater pumping
Land use
Calculation units
Villages
Soils
Figure 8.6
Overlays with ArcView to derive unique combinations of land use, irriga-
tion management and soils for the regional analysis in Sirsa District.
surface characteristics can be derived from different types of satellites. First, instan-
taneous evapotranspiration is computed, which is subsequently scaled up to 24 hours
and longer periods. In addition to satellite images, the SEBAL model requires daily
average data on wind speed, humidity, solar radiation and air temperature.
8.3.4 Measurements
To run SWAP, we collected data at experimental stations and in farmer ields. Trials at
experimental stations in the area were used to calibrate input parameters of the main
crops (Bessembinder et al.,
2003
). A total of 24 farmer ields with different crops,
soils, groundwater levels and canal water allocation were monitored to identify the
yield gap between experimental stations and farmer ields. Regional geographical data
were collected and digitized to perform a regional analysis with distributed modelling.
Overlays of maps on land use, topography (villages) and soils, each with a grid size of
30 m, yielded 2404 unique combinations for entire Sirsa District (
Figure 8.6
).
8.3.5 Yield Gap
Crop yield is much higher at the experimental stations, in comparison to the farmer ields
(
Table 8.2
). To arrive at 7.4 tons of wheat ha
-1
, farmer yields should increase with 61%.
In case of cotton, the farmer yields should increase with 38%. Also water productivity is
much higher at the experimental stations: in case of wheat 67%, in case of cotton 62%.
This means that with the same amount of water, the yield of wheat may increase with
67% and of cotton with 62%. The main differences between the experimental station and
Search WWH ::

Custom Search