Geoscience Reference
In-Depth Information
2.0
r
a
=20sm
-1
r
a
=40sm
-1
r
a
=60sm
-1
1.5
1.0
0.5
0.0
0
50
100
150
200
r
c
(s m
-1
)
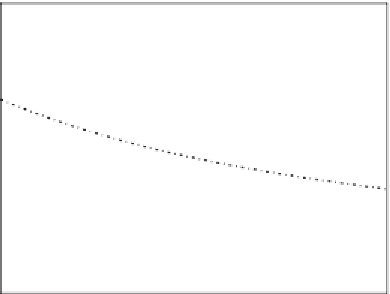
Figure 7.8
Priestley-Taylor
α
PT
as a function of canopy resistance
(a)
. Symbols
show observations obtained in 1977 at Cabauw (The Netherlands) at local noon for
sunny conditions. (Data from DeBruin,
1983
). Lines show
α
PT
for a range of aerody-
namic resistances, as calculated from the Penman
-
Monteith equation (with
Q* - G
= 500 W m
-2
, RH = 50% and
T
a
= 25 ºC).
and hence
L
v
E
equals
L
v
E
eq
. The Bowen ratio at this point is
β
γ
β
==
s
eq
and the cor-
ρ
c
e
QG
e
()
*
T
−
=
+
( )
p
1
β
a
responding canopy resistance can be derived to be
r
sat
a
eq
c,eq
γ
−
(see Jacobs and de Bruin,
1992
). This
r
c,eq
is typically of the order of 50 s m
-1
which is
representative of well-watered low vegetation. Hence, for well-watered surfaces, the
sensitivity of evapotranspiration to aerodynamic resistance (and thus to wind speed)
is rather limited.
Question 7.11:
Why does the Priestley-Taylor coeficient
α
PT
decrease with increasing
canopy resistance (see
Figure 7.8
). Use the Penman-Monteith equation in your answer.
Question 7.12:
Explain why at high values of the canopy resistance the evaporation
decreases with decreasing aerodynamic resistance (see
Figures 7.3b
and
7.8
).
7.3.3 Makkink Equation
Already in 1957 (15 years before the paper of Priestley and Taylor) Makkink (
1957
)
found that the evapotranspiration of grass for Dutch summer conditions could be esti-
mated as:
s
LE
v
=
c
Kc
↓+
(7.19)
1
2
s
+
γ


Search WWH ::

Custom Search