Geoscience Reference
In-Depth Information
25
25
bright
overcast
PA I
GAI
LAI
20
20
15
15
10
10
5
5
0
0
0
500
1000
1500
2000
0 123
4
5
PAR(µmol m
-2
s
-1
)
Plant area index (-)
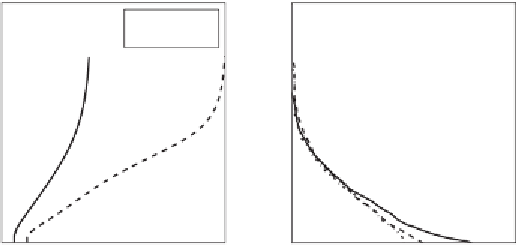
Figure 6.22
Radiation penetration in the vegetation of an Alpine pasture. (Right)
Cumulative plant area index (PAI), green area index (GAI) and leaf area index (LAI).
(Left) Proile of intensity of PAR for a clear and an overcast day. (Data from Tap-
peiner and Cernusca,
1989
.)
is used for photosynthesis. Therefore, overcast conditions are relatively beneicial
in terms of the total carbon ixation: the total amount of radiation is lower, but more
evenly spread in the vertical. Related to the vertical variation of net assimilation,
the stomatal resistance also varies with height (see
Section 6.4.3
). Furthermore, the
variation in radiation affects the energy input to the leaf and hence it's temperature
(see
Section 6.6.4
).
The attenuation described by Eq. (
6.39
) represents the (horizontal) mean var-
iation of radiation with height. But owing to the porous nature of vegetation, the
horizontal variation of downward radiation in the canopy can be large: certain loca-
tions may be exposed to direct sunlight, whereas others may be exposed only to
multiply relected light (see
Figure 6.23
). The penetration of radiation also changes
continuously owing to the changes in azimuth and zenith angle of the sun, and to
the motion of leaves and branches caused by wind. Furthermore, leaves are not nec-
essarily oriented horizontally; hence the amount of radiation received by a leaf may
be larger or smaller than the amount of radiation incident on a horizontal plane (this
holds mainly in the upper part of the canopy where the fraction of direct radiation
is still high).
Question 6.8:
The attenuation as described in Eq. (
6.39
) is deined in terms of broad-
band shortwave radiation.
a) Suppose a global radiation of 800 W m
-2
above a vegetation, an extinction coefi-
cient (
a
in the equation) of 0.5 and values for
A
of 1.5 halfway up the canopy and
A
is
4 at the loor of the canopy. Compute the global radiation at the two levels (halfway
and at the bottom).
b) From
Figure 6.21
we can see that the transmission and relection characteristics of
leaves are different for different wavelengths. Consider radiation of 0.5
μ
m wave-


Search WWH ::

Custom Search