Geoscience Reference
In-Depth Information
H
> 0
H
= 0
H
< 0
Low wind
speed
High wind
speed
Low wind
speed
very
unstable
weakly
unstable
neutral
weakly
stable
very stable
negative
positive
Ri
f
z
/
L
0
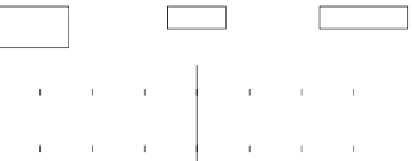
Figure 3.15
Stability parameters (Richardson number and
z/L
): link between sign
and stability. The shape of the arrows indicates the effect of stability on turbulent
vertical motion (enhanced for unstable, suppressed for stable). The thickness of the
arrows indicates the intensity of the motion. At the top the sign of the sensible heat
lux and the typical magnitude of wind speed are given.
With this equivalence of
z
/
L
and
Ri
f
we can also look at the height dependence of
z
/
L.
As
L
depends only on the surface luxes, the only height dependence stems from
z
.
Hence, below a certain level
|z
/
L|
is so small that shear dominates TKE production,
whereas high above the surface buoyancy dominates. It can be deduced, from Eq.
(
3.32
), that for unstable conditions the level where shear production and buoyancy
production are equal is located at
z
≈0.
.
Note that although
Ri
f
and
z/L
have qualitatively similar behaviour, this does not
mean that they are equal, or even proportional.
L
Question 3.14:
Observations at a given location and time show that the temperature
increases with height and that the sensible heat lux is negative.
a) Explain the relationship between the increase in temperature with height and the
sign of the sensible heat lux.
b) What is the sign of the Richardson number?
c) What is the sign of the Obukhov length (and hence
z/L
)?
d) In what way does buoyancy inluence the turbulence in this situation?
3.5.3 Similarity Relationships for Gradients
In
Section 3.5.1
the similarity relationships for gradients of mean quantities in the
surface layer were presented in general form (Eq. (
3.20
)). The inal step in the deter-
mination of similarity relationships is the determination of the shape of those rela-


Search WWH ::

Custom Search