Geoscience Reference
In-Depth Information
4
3
450
2
400
Excitation (nm)
350
1
300
0
300
400
500
600
700
450
400
350
300
300
400
500
600
700
Emission (nm)
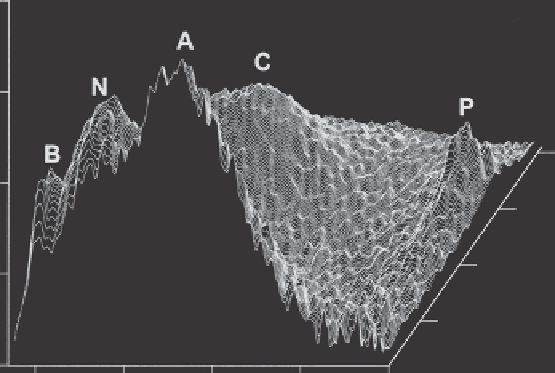
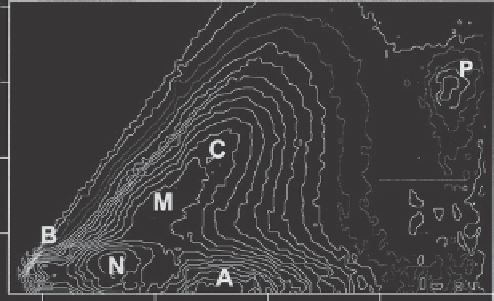
Figure 3.3. Fluorescence fingerprint representative of samples collected in the (Arabian Sea) upwell-
ing. Water Mass Type 4. Although typical of most samples collected in the cool upwelling waters,
not all had the chlorophyll-like peak at ex/em = 400/685. (Reprinted from Coble et al.,
1998
, with
permission from Elsevier.) Note that the shortest excitation wavelength was 260 nm; therefore some
of the peaks noted in
Table 3.1
were not observed. The peak labeled A in the original figure is equiv-
alent to peak A
C
according to the revised nomenclature proposed in this work.
et al.,
1998
). This humic-like component was considered to represent a pool of humic
material newly formed in the marine environment. It meets the criteria of a peak distinct
from peak C based on two observations. The first was its appearance in some samples as a
nearly pure fluorophore, with round contours in map view, and the second was the appear-
ance of distinct M and C peaks in some samples (
Figure 3.3
). Although the original reports
of this component did not include data below 260 nm excitation, it is now clear that peak M
is also always associated with second peak from excitation in the UVC region called peak