Geoscience Reference
In-Depth Information
0.9
0.8
0.7
0.6
0.5
0.4
0.3
0.2
0.1
0
440
420
400
380
(a)
440
420
400
380
360
340
320
300
280
260
240
(b)
0.55
0.5
0.45
0.4
0.35
0.3
0.25
0.2
Whole Water
HPOA
360
340
320
300
280
260
0.15
0.1
0.05
240
300
350
400
450
500
550
600
300
350
400
450
500
550
600
440
420
400
380
440
420
400
380
360
340
320
300
280
260
240
0.9
0.8
0.7
0.6
0.5
0.4
0.3
0.2
0.1
0
TPIA
(d)
HPIA
(c)
0.06
0.05
360
340
320
300
280
260
240
0.04
0.03
0.02
0.01
0
300
350
400 450
Emission Wavelength, nm
500
550
600
300
350
400 450
Emission Wavelength, nm
500
550
600
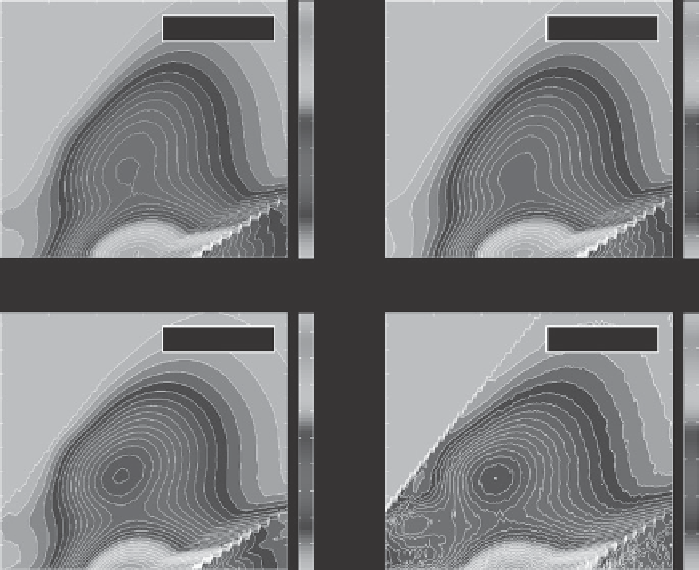
Figure 2.3. Excitation-emission spectra for the (a) whole water, and mass normalized EEMs for the
(b) hydrophobic organic acid, (c) transphilic organic acid, and (d) hydrophilic fractions of a water
sample from the Yukon River at Pilot Station, Alaska. (See Plate 2.)
whole water sample are often found in the hydrophobic fractions containing aquatic humic
substances (Aiken et al.,
1992
). In most cases, however, the hydrophobic fractions of DOM
do not contain all of the fluorpohores in a sample, and it cannot be assumed that this frac-
tion is representative of whole water fluorescence (Green and Blough,
1994
). To illustrate
this point, fluorescence data for the whole water, hydrophobic acid (HPOA; humic frac-
tion), transphilic acid (TPIA; intermediate polarity compounds), and hydrophilic fractions
(HPIA) of the DOM for a sample from the Yukon River obtained by the XAD approach
are presented (
Figure 2.3
). In this example, despite the strongest fluorescence intensity, the
HPOA fraction does not account for all signals in the whole water fluorescence. In each of
the more hydrophilic fractions, spectral maxima are blue shifted (to shorter wavelengths)
relative to the HPOA fraction.
2.4 Fluorophores of Interest
With the exception of anthropogenic compounds found in wastewaters, organic fluoro-
phores in soils and aqueous systems are largely limited to conjugated aromatic molecules