Geoscience Reference
In-Depth Information
440
(a)
0.07
420
400
0.06
380
0.05
360
0.04
340
320
0.03
300
0.02
280
0.01
260
240
0
300
350
400
450
500
550
600
0.14
440
(b)
420
0.12
400
0.1
380
360
0.08
340
0.06
320
300
0.04
280
0.02
260
240
0
300
350
400
450
500
550
600
440
(c)
2
420
400
380
1.5
360
340
1
320
300
0.5
280
260
240
0
300
350
400 450
Emission Wavelength, nm
500
550
600
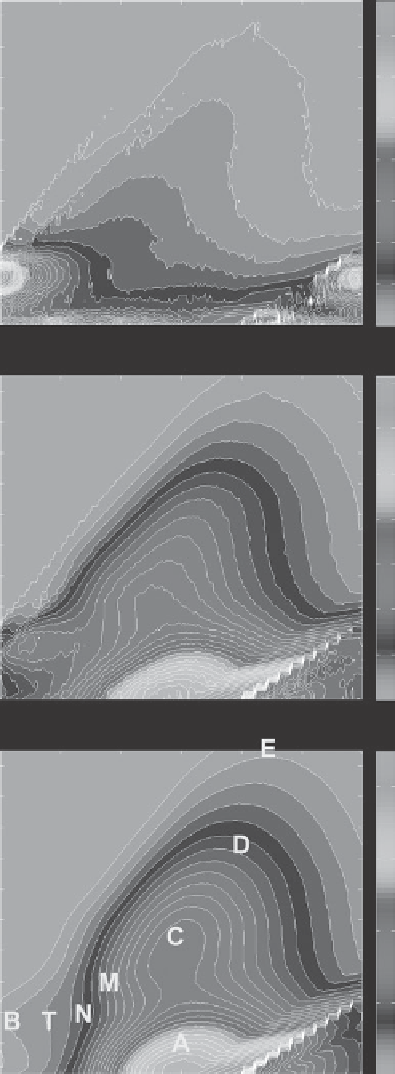
Figure 2.2. Excitation emission spectra for samples from (a) the Pacific Ocean, (b) the Gulf of Maine,
and (c) the Penobscot River. Commonly reported peaks and region locations described in
Table 2.1
are also graphically presented in (c). (See Plate 1.)