Geoscience Reference
In-Depth Information
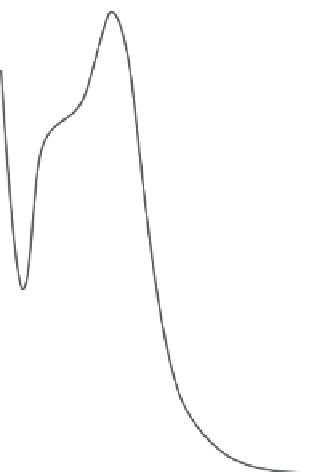
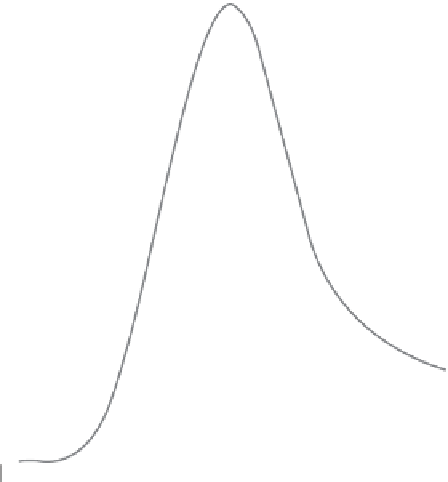
Stokes shift
300
350
400
450
500
550
600
Wavelength (nm)
Figure 1.9. Stokes shift observed between the excitation (blue) and emission (red) spectra.
Substituting for [M*] from
Eq. (1.8)
gives
( )
=
It kM
[
]
0
exp
(
−
kt
)
(1.10)
*
F
R
F
Substituting for [M*]
0
from
I
F
(0) =
k
R
[M*]
0
, where
I
F
(0) is the intensity at the time of the
initial excitation, into
Eq. (1.10)
gives
( )
=
It I
()
0exp
(
−
k t
)
(1.11)
F
F
F
Therefore the intensity decays exponentially after the initial excitation pulse. The fluores-
cence lifetime of the excited state,
τ
F
, can be represented as
τ
F
= (1/
k
F
). The fluorescence
lifetime of a molecule is defined as the time taken for the excited state population to fall to
1/e of that initially excited.
Equation (1.11)
can then be rewritten as
( )
=
( )
−
It I
0
e
/
τ
(1.11)
t
F
F
F
Equation (1.11)
relates the measured parameter of intensity to the fluorescence lifetime,
enabling its calculation experimentally. Possible methods for the determination of the