Geoscience Reference
In-Depth Information
1
6
A
i
DOP
4
TDP
0.5
2
TDN
C4
0
C5
C1
C2
0
DOC
a375
−2
DON
C3
−4
−0.5
−2
0
2
4
6
8
10
−0.5
0
0.5
1
Scores on PC 1 − 62.4 %
Loadings on PC 1 − 62.4 %
1
B
(i-iii)
TDN
4
0.5
DON
2
C5
C1
0
DOP
DOC
C2
C4
0
TDP
a375
C3
−0.5
−2
−1
−4
−2
0
2
4
6
−0.5
0
0.5
1
Scores on PC 2 − 16.4 %
Loadings on PC 2 − 16.4 %
1
4
C
(i-iii)
C5
0.5
C4
2
C1
DOC
0
C2
DOP
TDN
a375
C3
TDP
0
DON
−0.5
−2
−1
−4
−2
0
2
4
6
−0.5
0
0.5
1
Scores on PC 2 − 16.4 %
Loadings on PC 2 − 16.4 %
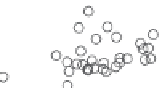
Figure 10.9. Principal components analysis of PARAFAC components and water quality parameters
for the Horsens catchment data set. Score plots (A-C) showing variation among sites are on the
left, loading plots (i-iii) showing correlations between measured variables are on the right. (See
Plate 17.)
et al.,
2006
). The sampling station on the outflow of a wetland area in the Hansted system
(R14) has the highest concentrations of TDN and DON (
Fig. 2
in Stedmon et al.,
2006
).
Thus, the PCA components results reveal differences in the supply of organic C, N, and P
that appear to be related to land use.
10.8.4 Supervised Learning Techniques
In contrast to exploratory data analysis that mostly uses unsupervised learning, super-
vised learning involves developing models from data that are paired with a desired set
of outcomes, which are used to guide the estimation of the models. In chemometrics,