Geoscience Reference
In-Depth Information
C1
C2
C3
C4
C5
0.4
0.3
0.25
0.25
0.4
0.3
0.2
0.2
0.2
0.3
0.15
0.15
0.2
0.2
0.1
0.1
0.1
0.1
0.1
0.05
0.05
0
0
0
0
0
300 400 500 600
300 400 500 600
300 400 500 600
300 400 500 600
300 400 500 600
600
600
600
600
600
500
500
500
500
500
400
400
400
400
400
300
300
300
300
300
300 350 400
300 350 400
300 350 400
300 350 400
300 350 400
Ex. (nm)
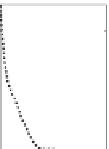
Figure 10.6. PARAFAC decomposition of the Horsens catchment fluorescence dataset. Spectra
are shown above contour plots, with spectra for two independently modeled halves of the data set
overlaid.
1
1
1
0.8
0.8
0.8
0.6
0.6
0.6
0.4
0.4
0.4
0.2
0.2
0.2
0
0
0
200
400
600
200
400
600
200
400
600
1
1
0.8
0.8
0.6
0.6
0.4
0.4
0.2
0.2
0
0
200
400
600
200
400
600
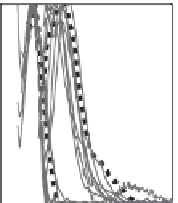
Wavelength (nm)
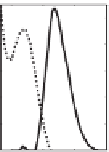
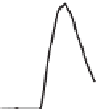
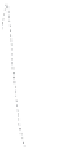
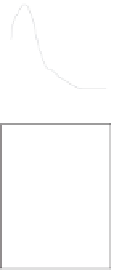
Figure 10.7. PARAFAC spectra in the Horsens catchment model (dotted lines) compared to PARAFAC
spectra in 10 published models (thin lines). See the Appendix for inter-model comparisons.