Geoscience Reference
In-Depth Information
13
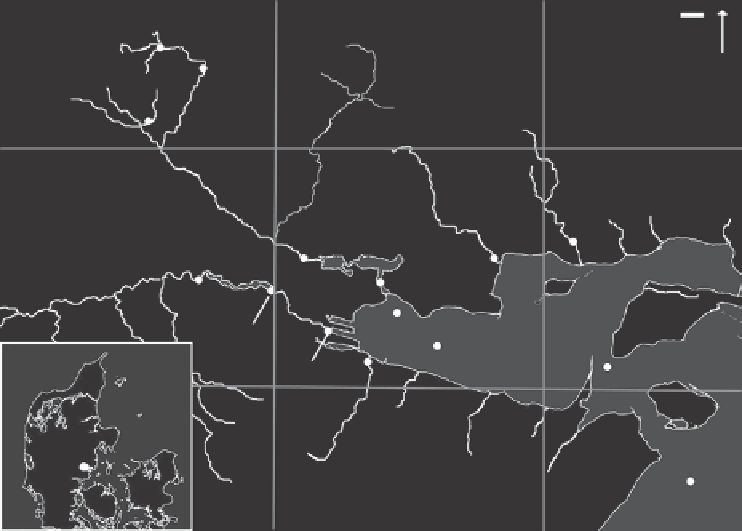
1km
14
N
27
55°55' N
Hansted Å
S
ø
vind Å
Lake
N
ø
rrestrand
10
8
Lake
Bygholm
11
Bygholm Å
9
6
4
Horsens fjord
7
3
Denmark
16
2
12
55°50' N
Klokkedal Å
1
9°40' E
10°00' E
Figure 10.1. Locations of sampling sites in the Horsens catchment data set. (Adapted from Stedmon
and Markager,
2005b
.)
continuation of the original table (
Figure 10.2B
) or alternatively, as a three-way (
multiway
in general) data set in which sample, emission wavelength, and temperature form the three
right-angled axes of a box (
Figure 10.2C
). If the entire experiment were to be repeated for
a range of excitation wavelengths, a four-way data set would result; and so on for as many
modes or ways as there are cross-wise factors in the data set. Notice that for each data set
in
Figure 10.2
, the actual measurements are fluorescence intensities - not temperature,
emission, or anything else.
An advantage of multiway techniques is that they retain, and make use of, information
about the structure of data sets in more than two modes. For example, in
Figure 10.2B
, if
we take a slice through the box at emission wavelength
x
2
, we obtain a matrix of samples
by temperature that retains the original sequence of variables
t
1
to
t
4
. Conversely, when the
data set is “unfolded” as in
Figure 10.2C
, the temperature sequence is broken, and each
temperature in the data set is analyzed without reference to the others. Thus, when a data
set that has a genuine three-way underlying structure is unfolded, information implicit in
the ordering of variables along the unfolded axes is lost. Some of the models that operate
on multiway data also have what is known as the “second-order advantage,” a property
that is hugely powerful in the analysis of complex data sets (Booksh and Kowalski,
1994
).
Essentially, this makes it possible to obtain quantitative estimates of chemical analytes