Geoscience Reference
In-Depth Information
6000
5000
4000
3000
2000
F
max
1000
0
200
250
300
350
400
450
500
λ
em
(nm)
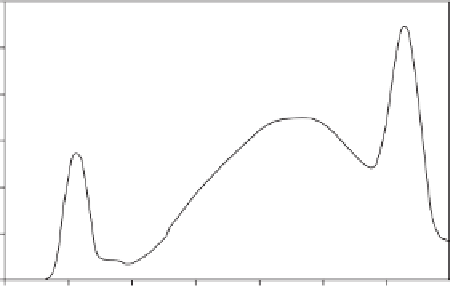
Figure 9.3. Fluorescence emission spectrum of an aqueous extract of soil at an excitation wavelength
of 254 nm. The broad humic peak (300-500 nm) can be seen between the two sharp Rayleigh scat-
tering peaks. The shaded regions represent the areas used to calculate the HIX
EM
. The index is calcu-
lated by dividing the area under the upper region (435-480 nm) by the area under the lower region
(330-345 nm) and is associated with the degree of humification in the sample.
F
max
indicates the peak
emission intensity. (From Zsolnay et al.,
1999
.)
16
Fulvic Acids
14
Muck Soil
a.d.
12
f.f.
10
a.d.
fumigated muck
all o.d soils
8
f.f.
6
Mineral Soils
4
fumigated mineral soils
2
0
0
1 2
Stand. Relative Fluorescence (mg g
-1
)
3
4
5
6
7
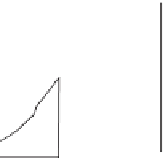
Figure 9.4. Comparison of the standard relative fluorescence intensity (in units of quinine sulfate
dihydrate equivalent) to HIX
EM
. Muck soils and mineral soils were treated by air drying, oven dry-
ing, and fumigation and then extracted aqueously for fluorescence analysis. The fulvic acid fraction
of each soil was obtained with NaOH pyrophosphate. This plot shows the different signals from the
field fresh (f.f), air dried (a.d.), oven dried (o.d.), and fumigated samples, indicating drying processes
release different fractions of organic matter. (From Zsolnay et al.,
1999
.)