Geoscience Reference
In-Depth Information
(a)
500
A = humic-like
B = tyrosine-like
C = humic-like
M = marine humic-like
T = tryptophan-like
450
400
350
C
M
300
A
B
250
300
350
400
450
500
550
Emission Wavelength, nm
(b)
500
HIX
S-FA
Fulvic Acid (HIX
S-FA
)
HIX
SYN
Whole Water (HIX
S-ww
)
HIX
EM
HIX
FI
Peak T/ Peak C (T/C)
HIX
S-FA
450
HIX
S-FA
400
HIX
S-WW
FI
FI
BIX
BIX
HIX
S-FA
HIX
S-WW
350
T/C
300
T/C
HIX
HIX
EM
EM
250
350
350
400
450
500
550
Emission Wavelength, nm
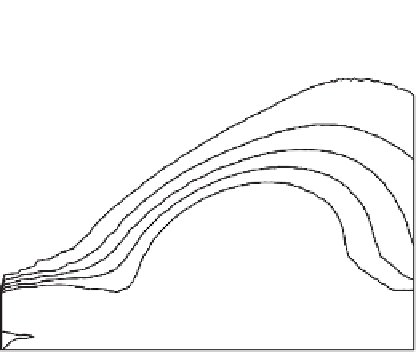
Figure 9.1. Identified regions of a typical representative corrected excitation-emission matrix (EEM)
in Raman units
(a)
, and measurement locations of fluorescence indices
(b)
discussed in this chapter.
Where an area is used by Zsolnay et al. (
1999
), the emission wavelength range is shown by a line.
Information plotted here can be found in
Tables 9.1
and
9.2
.
inability of
in situ
detectors to measure multiple wavelengths. It can be anticipated that in
the future,
in situ
fluorometers will be developed that have the capabilities to measure a full
EEM with reasonable spectral resolution. In either case, these fluorescence measurements
result in large quantities of spectral data requiring analysis to be interpreted in a meaningful
manner. In laboratory measurements with a modern scanning fluorometer, one EEM typic-
ally represents a large amount (typically 2000-3000 wavelength pairs) of data. Similarly,