Geoscience Reference
In-Depth Information
0.035
0 hours
24 hours
48 hours
72 hours
0.030
0.025
0.020
0.015
0.010
0.005
0.000
300
350
400
450
500
550
600
0.035
B
Initial
314 nm
335 nm
356 nm
375 nm
389 nm
395 nm
0.030
0.025
0.020
0.015
0.010
0.005
no filter
0.000
300
350
400
450
500
550 00
Excitation wavelength (nm)
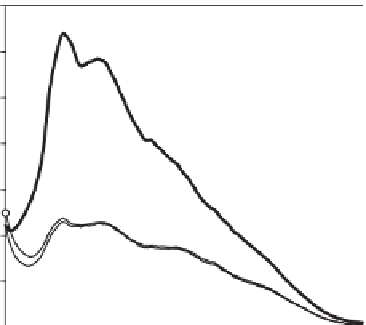
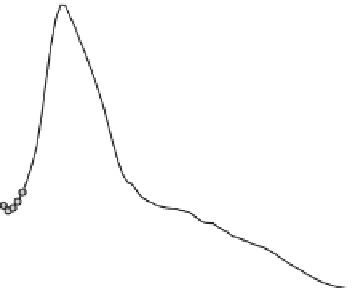
Figure 7.8.
(A)
The change in SF spectra (Δ
λ
= 14 nm) due to the photobleaching of Mackenzie River
DOM after exposure to sunlight for 3 days.
(B)
The change in SF spectra due to photobleaching,
showing the effect of removing increasingly short wave portions of incident irradiance through the
use of optical cutoff filters. In both experiments, the loss in SF intensity modified the spectral shape
of the DOM fluorescence, making river water DOM fluorescence similar in appearance to DOM
collected from the Mackenzie shelf region of the Beaufort Sea, western Canadian Arctic Ocean.
(Reprinted from Osburn, C.L., Retamal, L., and Vincent, W.F., Photoreactivity of chromophoric dis-
solved organic matter transported by the Mackenzie River to the Beaufort Sea.
Mar. Chem
.,
115
,
10-20, 2009, with permission from Elsevier.)