Geoscience Reference
In-Depth Information
A: River CDOM
D: Marine Surface
600
0.5
600
0.05
0.4
0.04
500
500
0.3
0.03
C
C
A
A
0.2
Int
Int
0.02
400
400
M
M
N
N
0.1
0.01
T
T
B
B
300
0
300
0
250
300
350
400
450
250
300
350
400
450
Excitation wavelength (nm)
Excitation wavelength (nm)
B: River Permeate
E: Marine Permeate
600
600
0.025
0.02
500
500
0. 1
0.015
C
C
A
A
Int
Int
0.01
400
M
400
M
0.05
N
N
0.005
T
T
B
B
0
300
300
0
250
300
350
400
450
250
300
350
400
450
Excitation wavelength (nm)
Excitation wavelength (nm)
C: River Retentate
F: Marine Retentate
600
600
3
2.5
0.6
500
500
2
0.4
C
C
1.5
A
A
Int
Int
400
M
400
M
1
0.2
N
N
0.5
T
T
B
B
300
300
0
250
300
350
400
450
250
300
350
400
450
Excitation wavelength (nm)
Excitation wavelength (nm)
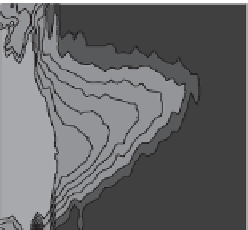
Figure 7.2. The variability in EEM fluorescence for whole DOM collected from surface waters com-
pared to ultrafiltered permeate (<1 kDa MWCO) and retentate (>1 kDa MWCO) fractions.
(A-C)
Susquehanna River water collected at the head of the Chesapeake Bay.
(D-E)
Coastal seawater col-
lected from the Middle Atlantic Bight. The boxes and letters on each EEM contour plot refer to the
fluorescent peak region designations from
Table 7.1
.