Geoscience Reference
In-Depth Information
CDOMIQSU
10
6
4
20
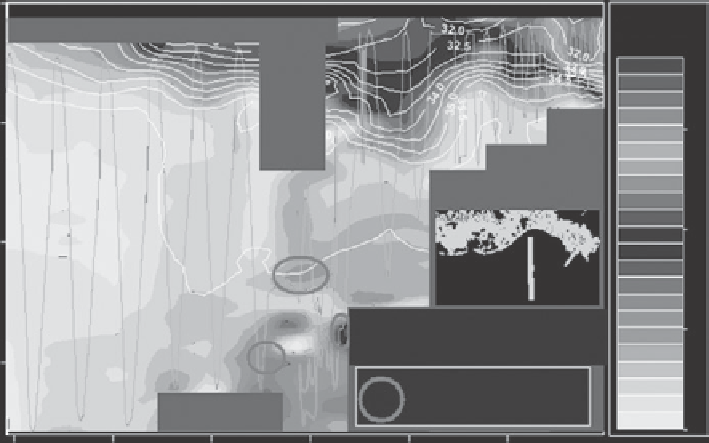
Colour contours: CDOM/QSU
Colour lines: Salinity/PSU
2
30
Subsurface
CDOM Maxima
0
28.6
28.7
28.8
28.9
29.0
29.1
North Latitude
Figure 6.17. CDOM (grayscale colors) and salinity (black lines) contours across the Mississippi
plume in June, 2000. Salinity is represented by the contour lines. Inset map shows the location of
the survey transect in relation to the Mississippi Delta. Gray lines represent path of towed vehicle
and gray boxes represent missing data. Bottom depths were approximately 5 m below the maximum
depths of the fluorescence and salinity measurements. Subsurface CDOM maxima are highlighted
with circles. (Redrawn from Chen and Gardner,
2004
.) (See Plate 13.)
of the river plume. Thin layers of CDOM maxima at depth are not accompanied by lower
salinities (
Figure 6.17
; circles) and are presumably formed by bacteria that are processing
particles that sink from the river plume and concentrate on density benches as a result of
stratification.
6.7 Remotely Sensed NOM Measurements
Fluorescence spectroscopy is a powerful tool in the study of organic matter in the ocean,
yet most important geophysical variable related to CDOM is its wavelength-dependent
light absorption coefficient (
a
g
λ
). Because CDOM absorbs light, it may influence verti-
cal distribution of phytoplankton, primary productivity, and water temperature. The color
of CDOM can be detected using space and airborne sensors (e.g., NASA - Moderate
Resolution Imaging Spectroradiometer [MODIS] and ESA - Medium Resolution Imaging
Spectrometer [MERIS]). This allows for the study of processes controlling the distribu-
tion of CDOM in the oceans in ways that are not possible using field measurements. In