Geoscience Reference
In-Depth Information
60
-0.2
-0.4
50
-0.6
40
-0.8
-1
30
-1.2
-1.4
20
-1.6
10
Granite Ave.
Bridge
-1.8
-2
0
0
1
2 3
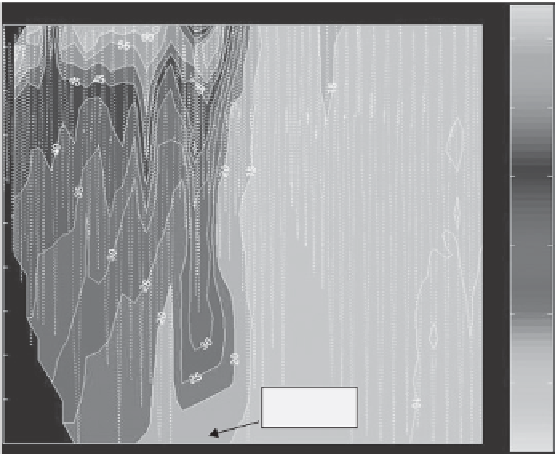
Distance from dam/km
4
5
6
Figure 6.15. CDOM fluorescence in the Neponset Estuary at high tide. Dotted lines represent path of
towed vehicle Bridge is located 2.6 km from dam. (See Plate 11.)
a nonconservative mixing curve of salinity with CDOM. River CDOM inputs were seen to
fluctuate with discharge. Beyond source identification, the sensors on the towed platform
illustrated a tidal restriction imposed by a local bridge (2.6 km from dam) that imposed
a major influence on estuarine circulation. The effect of tidal restrictions on holding low
salinity, high CDOM water from flowing out with the tide, the effect of bottom topogra-
phy altering the circulation and thus CDOM variations at a single location, and temporally
varying CDOM freshwater endmembers were all documented at this site, demonstrating
the value of measurements at a centimeter scale.
6.6.2.2 Hudson River Estuary - Large Spatial and Small Temporal Scales
At a larger spatial scale, variability in the mixing of river and tributary sources can be
examined. CDOM has been measured and modeled in the Hudson Estuary where multiple
inputs (Hudson, Raritan, Hackensack, Passaic Rivers, and sewage outfalls) were differ-
entiated using a towed, undulating platform, the ECOShuttle (Chen and Gardner,
2007
;
Figure 6.16
). It was determined that the sewage effluent influenced CDOM distributions in
the upper New York Bay. Tidal mixing of several effluent sources added significantly to a
mid-estuary source of CDOM that is exported offshore with the Hudson River Plume. The
detection and quantification of this temporally varying CDOM resulted in the incorpor-
ation of this phenomenon in the biogeochemical module of the physical circulation models
for the region (Georgas and Blumberg, unpublished).